23 | Keysight | N9038A MXE EMI Receiver Self-Guided Demonstration - Demo Guide
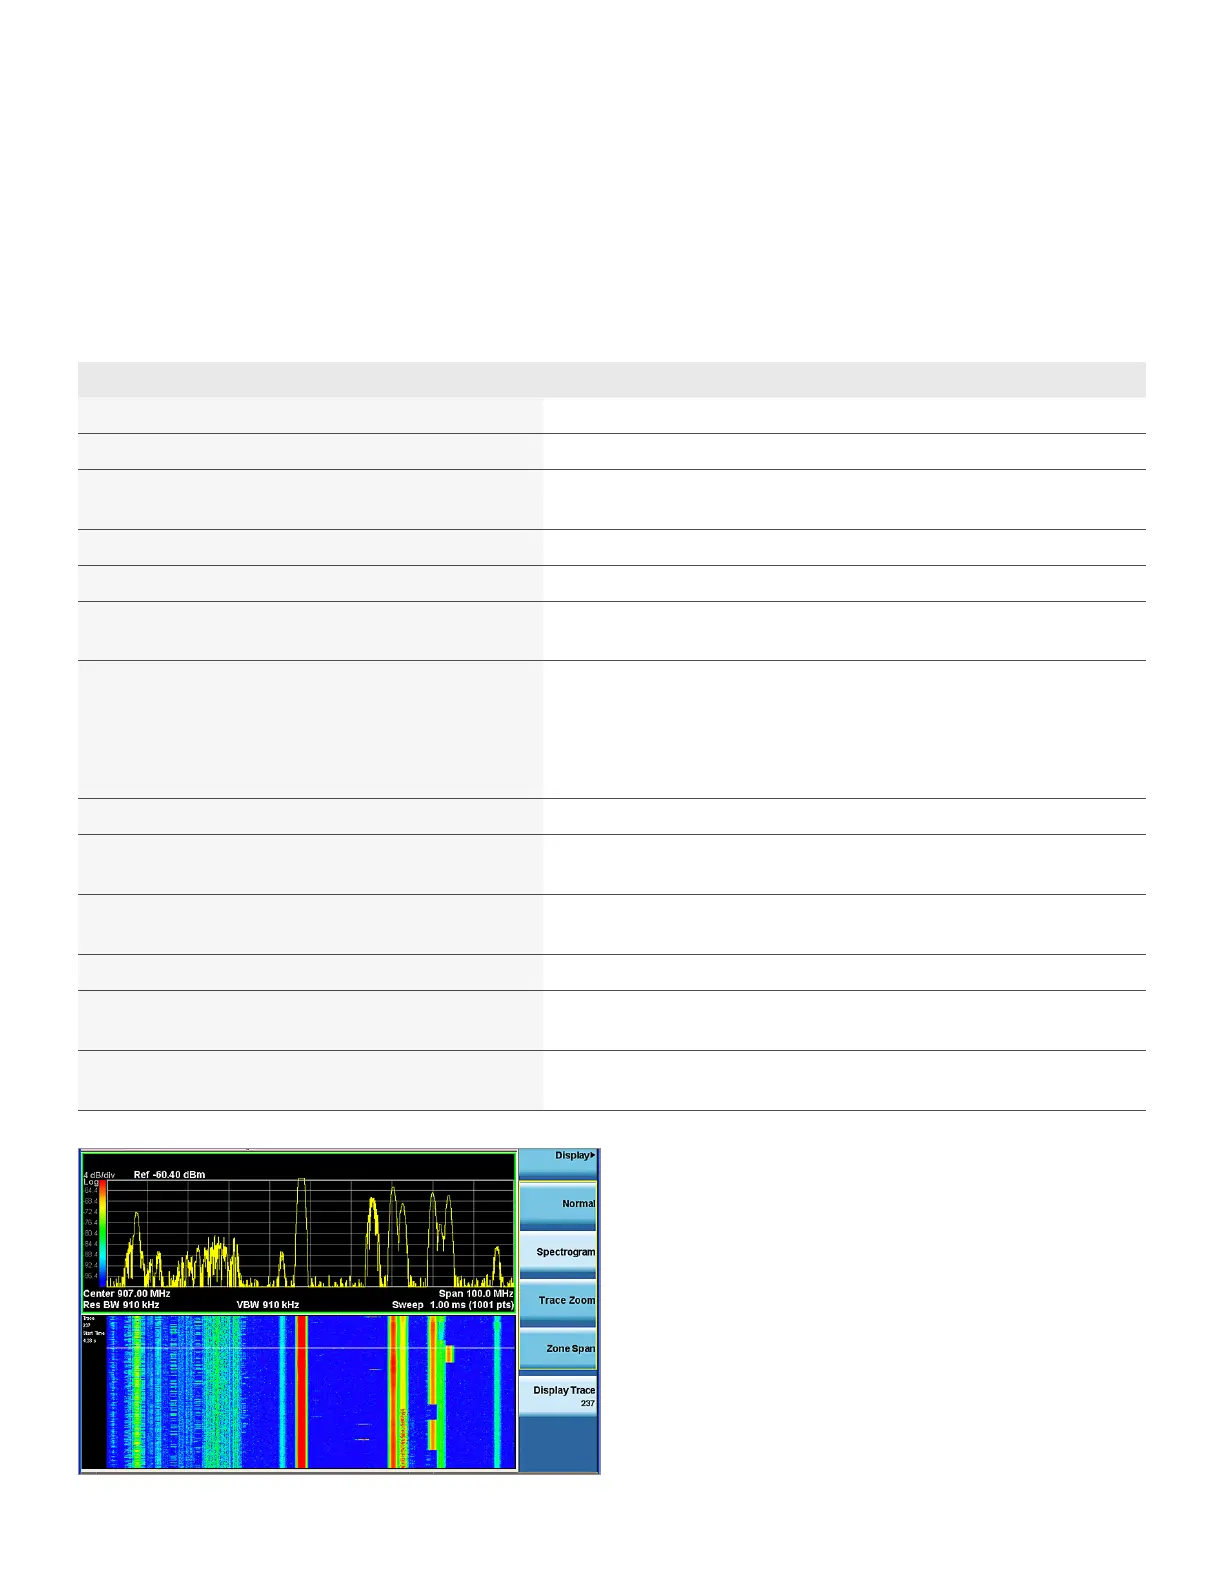
Spectrogram
Spectrogram is a tool for tracking signal characteristics in both frequency and time
domain. It’s a powerful tool to analyze time variant and frequency hopping signals.
In this demonstration, we will use spectrogram to analyze intermittent pulsed signals.
We will demonstrate how to automatically adjust spectrogram colors as well as play
back the spectrums with {Display Trace} and measure the amplitude, frequency, and time
of signals on current display trace.
Figure 21. Spectrogram
Spectrogram Demo Instructions for MXE Keystrokes
Switch to frequency scan measurement [Meas], {Frequency Scan}
Select a signal from the list, preferably an intermittent pulse signal
Couple center frequency in spectrum analyzer mode to meter
frequency in EMI receiver mode by global center frequency
[Mode Setup], {Global Settings}, {Global Center Frequency On}
Switch to spectrum analyzer mode [Mode], {Spectrum Analyzer}
Turn on spectrogram [View/Display], {Spectrogram}
Set span to the appropriate value to observe the signals of interest
The update speed of spectrogram is proportional to span
Adjust spectrogram color for better signal contrast [View/Display], {Color Adjust}, {Auto Adjust Hue Positions}, this will adjust colors
automatically according to the levels of currently captured signals
Some other settings also affect spectrogram color: {Ref Hue}, {Ref Hue Position}, and
{Bottom Hue Position} under [View/Display] and as well as {Ref Level} under {AMPTD/Y
Scale}
Pause the spectrogram [Single]
Put a marker on a signal on the current trace and move to the signal
of interest
spectrum trace
Move the display trace line to play back past spectrum
to display a past spectrum
Put Marker 2 as the delta of Marker 1 on a signal on current trace [Marker], {Select Marker}, {Marker 2}, {Delta}, {Properties}, {Relative to}, {Marker 1}
Move Marker 2 to another signal on current spectrum trace to
compare with the signal on Marker 1 position
Read the delta value of amplitude, frequency and time of these two
signals with Marker1 and Marker 2
 Loading...