22 | Keysight | N9038A MXE EMI Receiver Self-Guided Demonstration - Demo Guide
Diagnostic Tools
In addition to world-class EMI compliance measurement features, the MXE offers a
full range of diagnostic tools that can speed up the time-to-repair, including spectrum
analysis, Strip Chart, spectrogram, trace zoom, and monitor spectrum. We will show you
how to use these tools for diagnostic testing in this section.
Spectrum analysis is one of the most powerful diagnostic tools used widely by EMC
engineers. The MXE allows you to move seamlessly between spectrum analyzer and EMI
receiver modes as shown in Step 3, Demo 2 in the Making Measurements section.
Strip Chart
Strip Chart can be used to monitor and record a signal amplitude over time. The three
detectors can be monitored at the same time for up to 2 hours of signal capture.
Strip Chart can also be synchronized with the rotation of the turn table to record
emission patterns, allowing you to identify and record the orientation of maximum signal
emission.
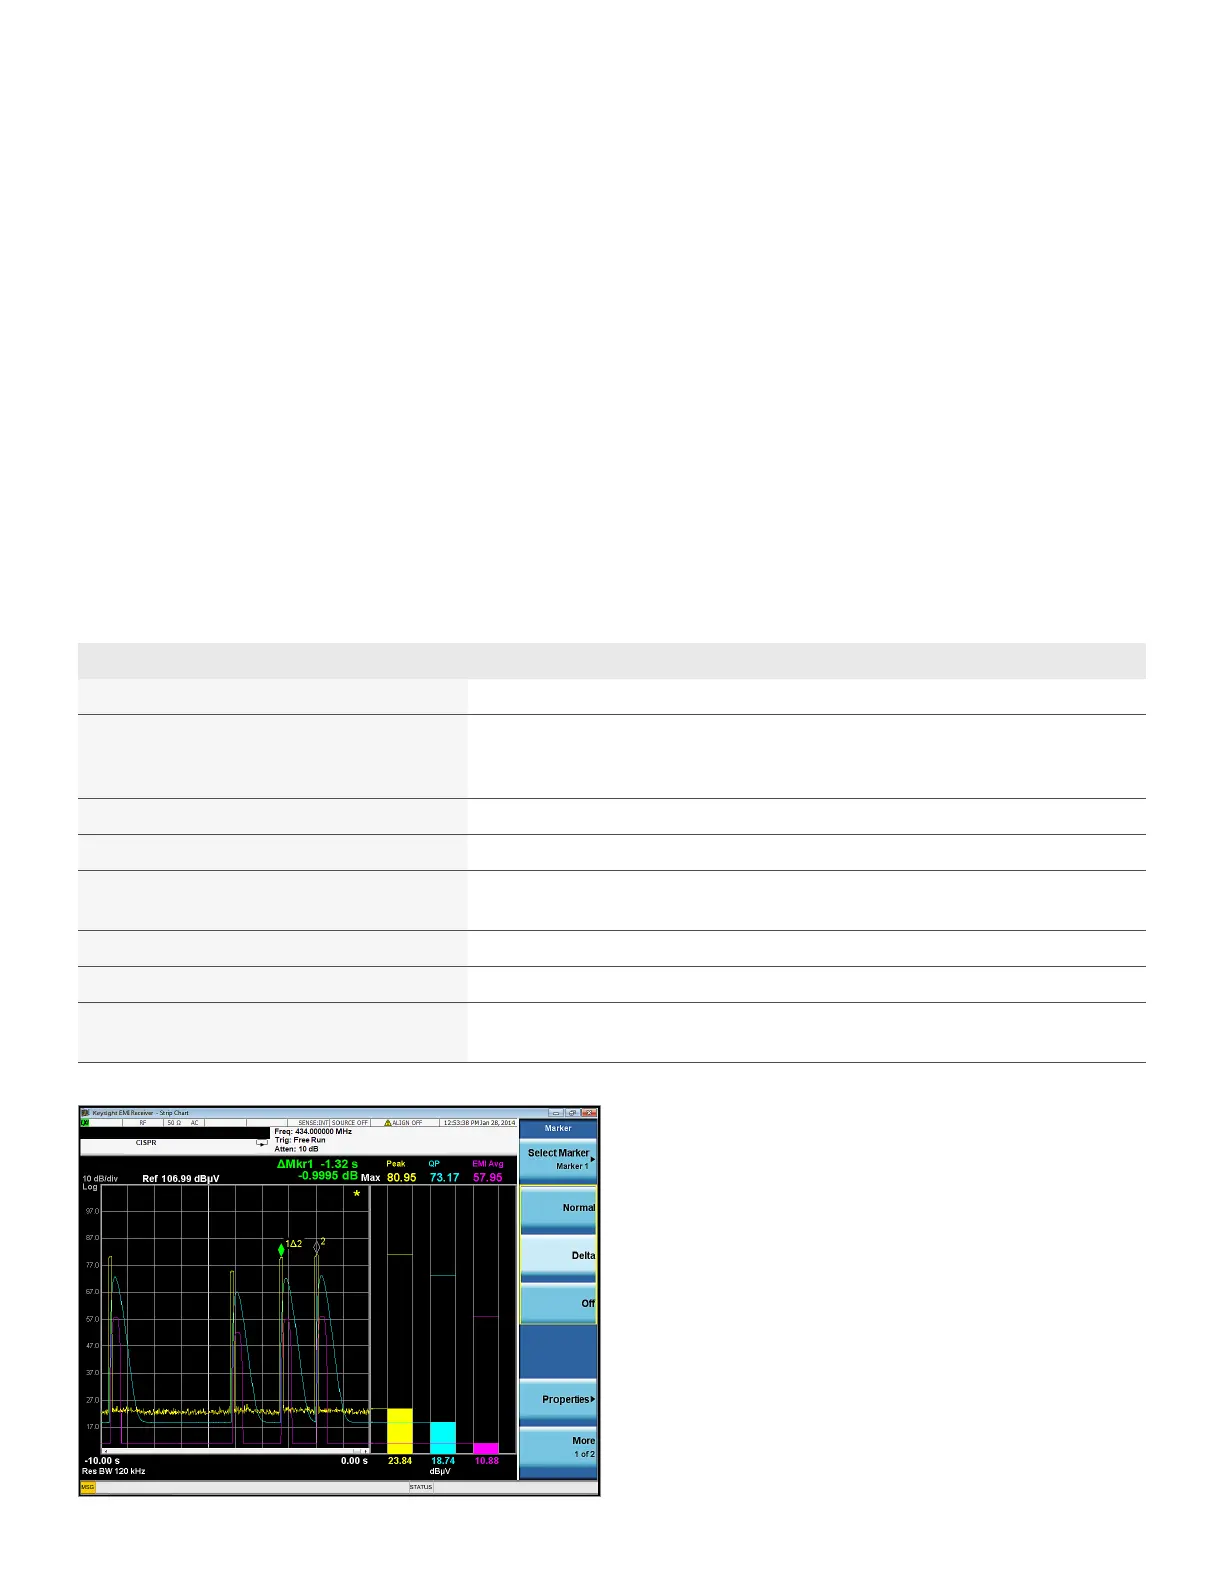
In this demonstration, we will use Strip Chart to capture a time variant signal and use
markers to analyze the time difference of two pulses.
Figure 20. Use Strip Chart to monitor a signal over time
Strip Chart Demo Instructions for MXE Keystrokes
Make sure you are in EMI receiver mode [Mode], {EMI Receiver}
Select a signal from the list
An FM signal with changing frequency or a time-varying
GSM signal are recommended for this demonstration
Switch to Strip Chart measurement [Meas], {Strip Chart}
Stop the data capture after 30 seconds of data [Sweep/Control], {Stop}
Zoom in by adjusting the scale and reference value of
time until you can see the appropriate pulses
Put a marker on the highest peak [Peak Search]
Put a delta marker on the next highest peak [Marker], { Delta}, [Peak Search], {Next Peak}
Now read the time and amplitude difference between
them on the top of the marker display
 Loading...