4.3.1 Groups organisation
The table below summarises the groups organisation and measured values available during a measurement dataset.
Group 1 Group 2 Group 3
Measured temperature
Max. value in temperature
Min. value in temperature
High alarm threshold in temperature
Low alarm threshold in temperature
Measured hygrometry*
Max. value in hygrometry
Min. value in hygrometry
High alarm threshold in hygrometry.
Low alarm threshold in hygrometry.
Measured light*
Max. value in light
Min. value in light
High alarm threshold in light
Low alarm threshold in light
Probe 1 measured parameter*
Max. value for probe 1
Min. value for probe 1
High alarm threshold for probe 1
Low alarm threshold for probe 1
Probe 2 measured parameter*
Max. value for probe 2
Min. value for probe 2
High alarm threshold for probe 2
Low alarm threshold for probe 2
Press key to change of group.
Press key to scroll the values in the group.
4.3.2 Measurements scroll
According to the selected parameters during the configuration and according to the type of device, the measurement scroll
is carried out like following:
Temperature Hygrometry* Light* Parameter 1 of probe* Parameter 2 of probe*
4.4 PC communication
➢ Insert the CD-ROM in the reader and follow the installation procedure of the KILOG software.
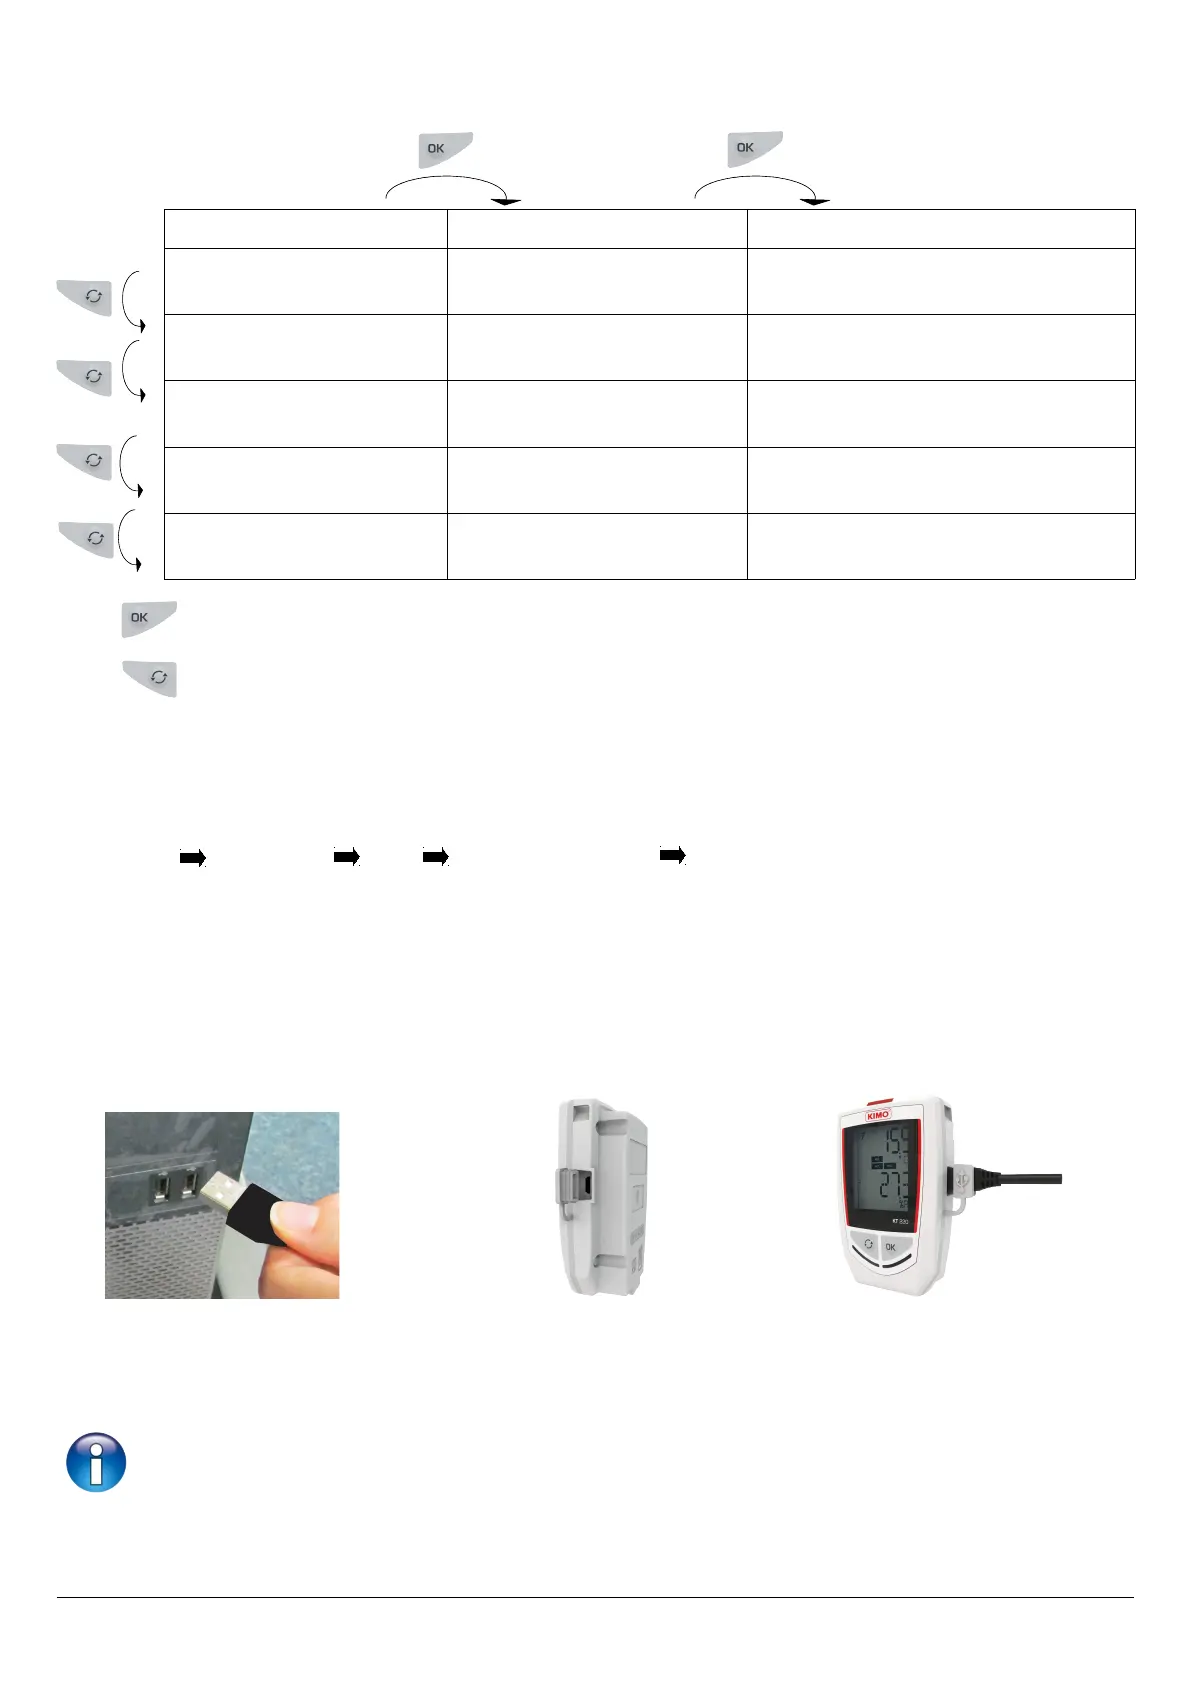
1. Plug the male USB connector of the cable to an USB connection on your computer**.
2. Open the USB cap on the right side of the datalogger.
3. Connect the male micro-USB connector of the cable to the female micro-USB connector of the device.
4.5 Configuration, datalogger download and data processing with the KILOG
software
Please see the KILOG software user manual: “KILOG-classes-50-120-220-320”.
The date and time updates automatically when a new configuration is loaded.
* Parameters available according to the device and probe type
** The computer must be in compliance with the IEC60950 compliance.
14 Use of the device
21 3