Device will power off after 30 minutes non-use.
Turn the dial or press a button to wake.
Disabled during Max / Min function.
Holding Select button while turning on disables Auto Power-Off
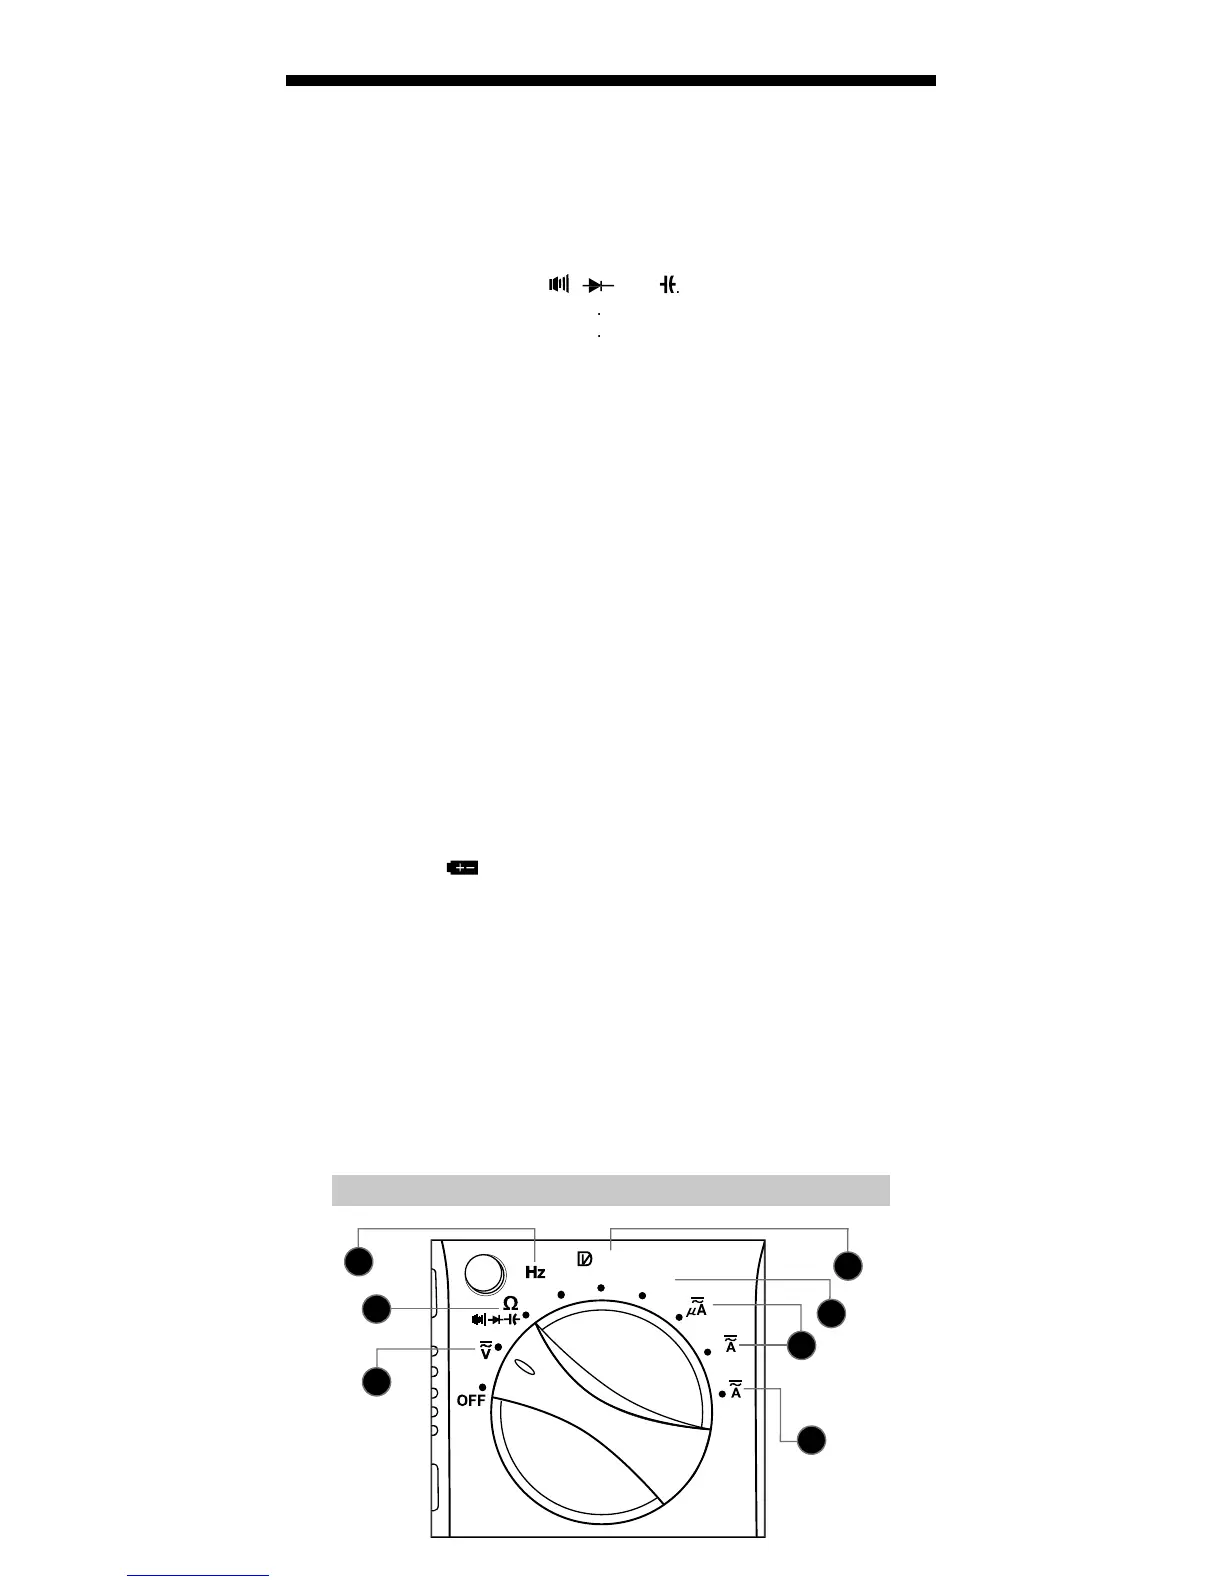
E. Select Functionality Button
Switch between AC and DC.
Press to store current value.
Display will now show the difference between the
stored and live readings.
Press again to return to live reading.
Press repeatedly to cycle through manual ranges.
Press for 2 seconds to return to auto ranging mode.
is displayed on LCD only during auto ranging mode.
Press to enter Max / Min mode; the largest and smallest
values will be saved while in this mode.
Press repeatedly to alternate between the maximum
Press for 2 seconds to return to live reading and
clear the stored maximum and minimum values.
Press to hold the current input on the display.
Press again to return to live reading.
Press for 2 seconds to enable / disable lights.
Using lights drains the battery signifi cantly.
J. K. Battery / Fuse Replacement
indicator is displayed on the LCD,
batteries must be replaced.
Remove rubber boot, back screw, and replace 2 x AAA batteries.
This meter uses 440mA / 1000V and 11A / 1000V fast blow fuses.
L. Magnetic Hanger Accessory
(Optional, Sold Separately)
Slide magnetic adapter into protective rubber boot.
Attach instrument to metal for hands-free use.
The bar graph shows an approximate analog representation
The bar graph responds much faster than the digital display.
The scale of the bar graph is zero to the maximum reading of








 To Next Page