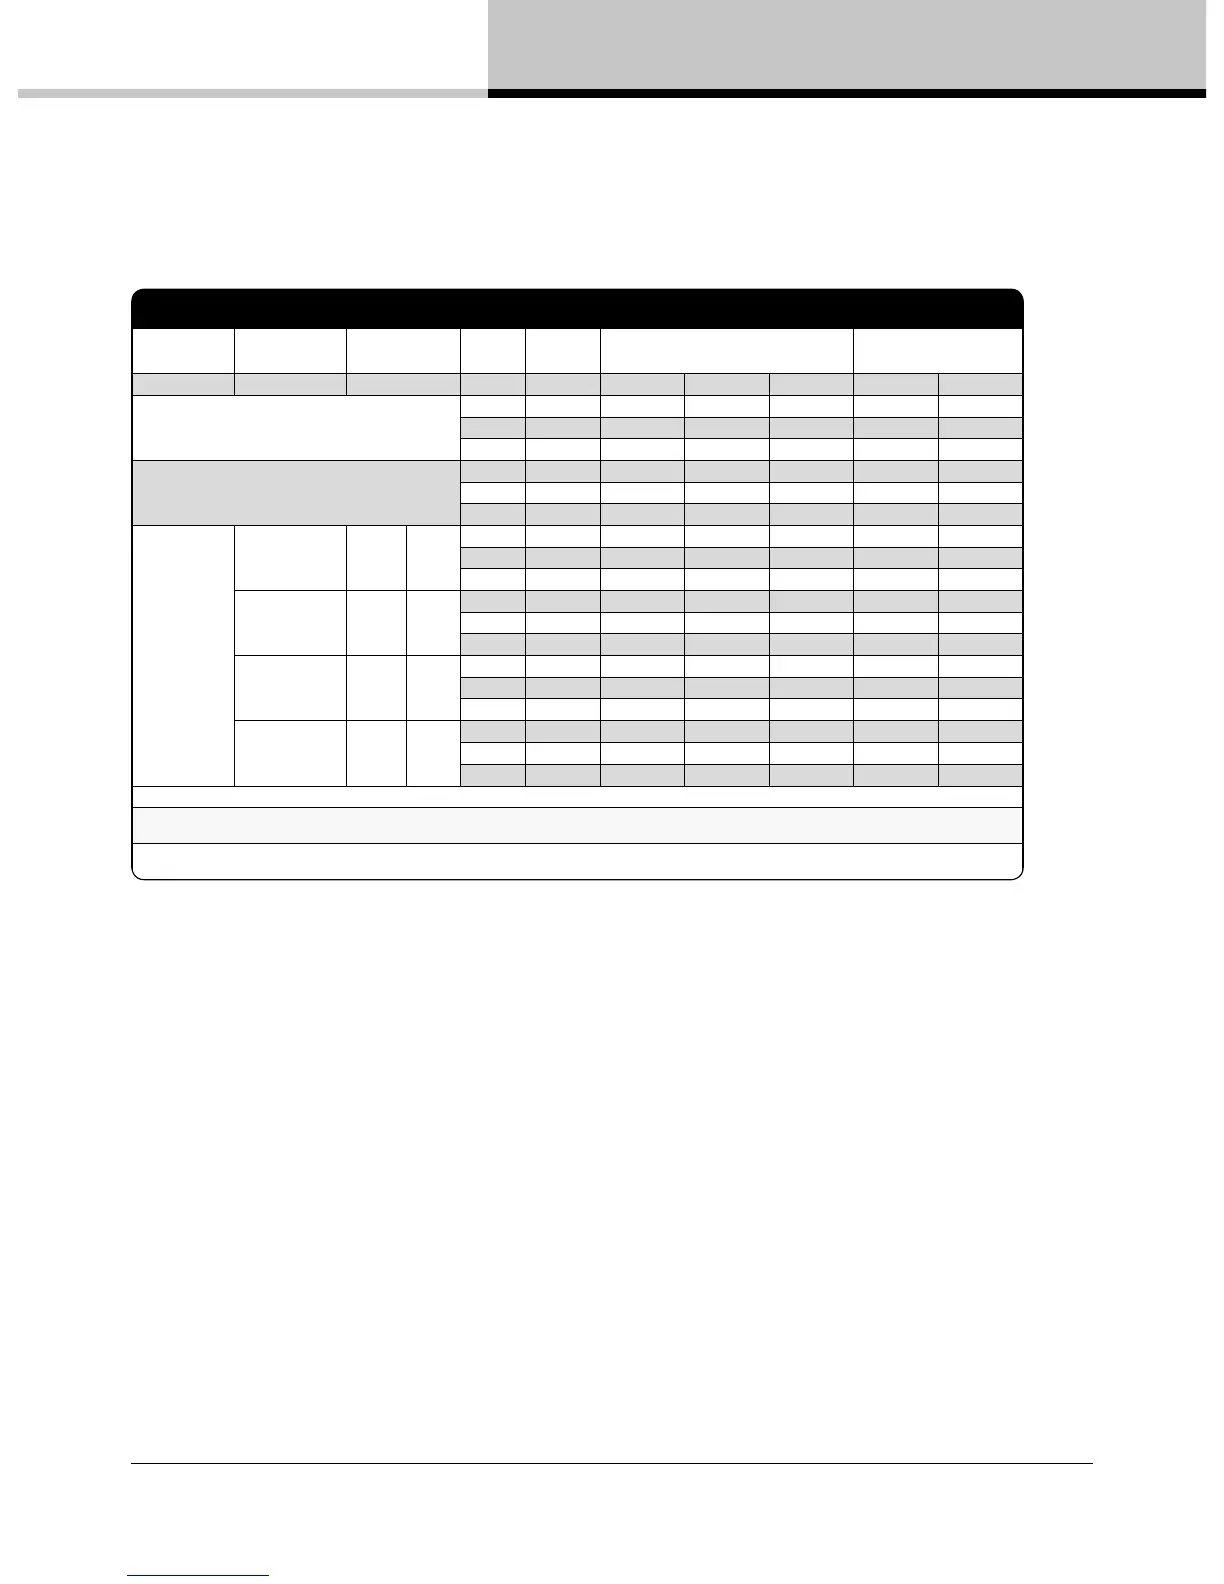
IPD 1200
Level Load Rated power
Mains
voltage
Line
current
Watt *1) Thermal Dissipation
VAC IAC *2) In Out Dissipated BTU/hr kCal/hr
Standby w. remote Power Off.
230 0.07 6.50 0 7 22 6
120 0.01 6.05 0 6 21 5
100 0.1 6.05 0 6 21 5
Power on, Idling
230 0.21 25.80 0 26 88 22
120 0.36 26.50 0 27 90 23
100 0.39 24.90 0 25 85 21
Pink Pseudo
Noise (1/8)
16 Ω / Ch. 150 x 2
230.0 0.5 68 38 30 103 26
120.0 1.0 71 38 34 116 29
100.0 1.1 71 38 34 116 29
8 Ω / Ch. 300 x 2
230.0 0.9 119 75 44 152 38
120.0 1.6 122 75 47 159 40
100.0 1.8 122 75 47 159 40
4 Ω / Ch. 600 x 2
230.0 1.8 226 150 76 260 65
120.0 3.0 234 150 84 288 73
100.0 3.4 229 150 79 269 68
2 Ω / Ch. 500 x 2
230.0 1.7 217 125 92 313 79
120.0 2.8 211 125 86 294 74
100.0 3.4 222 125 97 331 83
*1) The amplier’s PSU operates as a non-resistive load, so the calculation “Volts x Amps = Watts” would not be correct. Instead, measured and specied here
is what is known as the “Active Power” in the amplier providing useful, real-world values of power consumption and heat dissipation.
*2) Current draw gures measured at 230 V. as well as 120 V. The efciency is similar, but not identical for the two scenarios. The efciency for 100 V mains is
very similar to that of 120 V.