to scan blank.
3. Following the individual reagent system instructions, react each standard
solution beginning with 0 ppm. Continue with standards in increasing
concentration. Record the reading and the standard solution concentration
on a chart. Readings can be recorded as percent transmittance (%T) or
absorbance (A).
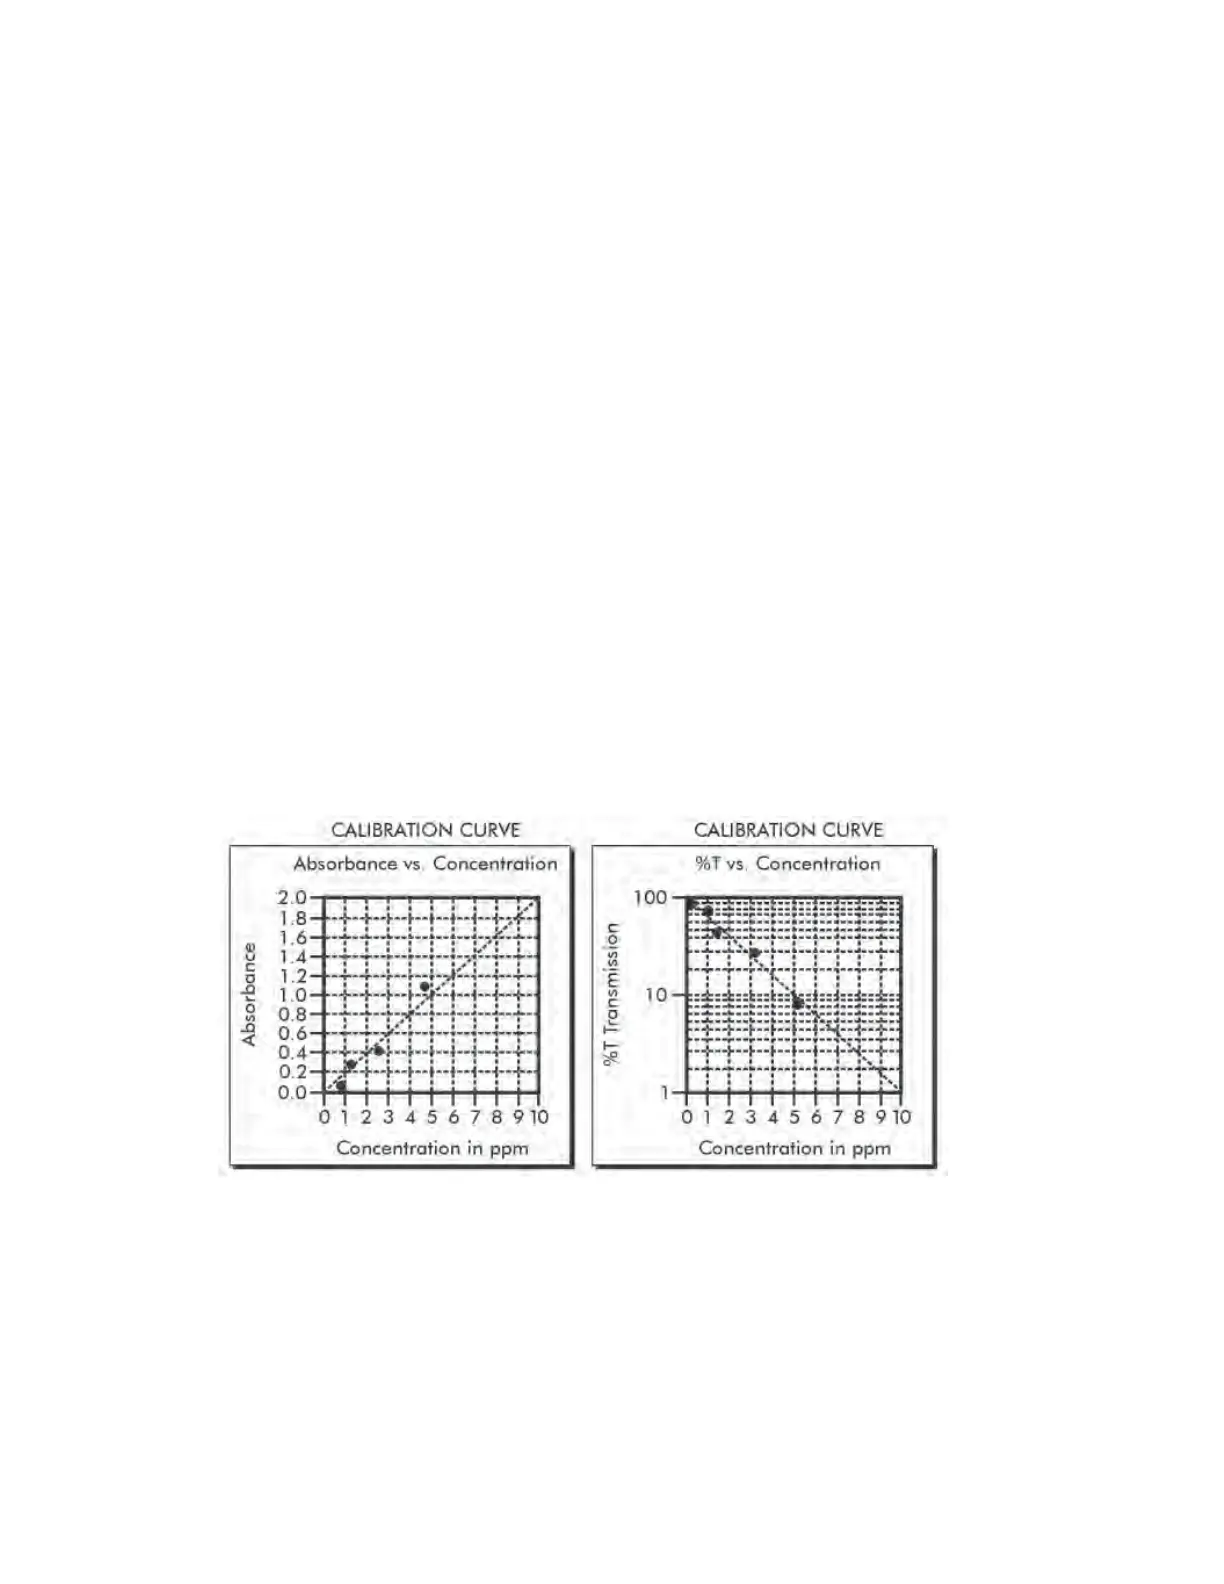
4. Plot results on graph paper or computer using any available plotting
program. If results are as %T versus concentration, semilog graph paper
must be used. Plot the standard solution concentrations on the horizontal,
linear axis, and the %T on the vertical, logarithmic axis. If results are as
absorbance versus standard solution concentration, simple linear graph
paper can be used. Plot the standard solution concentration on the
horizontal axis, and the absorbance on the vertical axis.
5. After plotting the results, draw a line, or curve, of best fi t through the
plotted points. The best fi t may not connect the points. There should be
approximately an equal number of points above the curve as below the
curve. Some reagent systems will produce a straight line, while others
produce a curve. Many computer spreadsheet programs can produce the
curve of best fi t by regression analysis of the standard solution data.
NOTE: Only reagent systems which produce a straight line can be used for a
User Test.
A sample of each type of graph appears below:
14 SMART3 Colorimeter 11.10
www.GlobalTestSupply.com
Find Quality Products Online at: sales@GlobalTestSupply.com