LAUNCH
21
item with will be shown on the top of the selected data stream list. To remove it from the top of the list, just
tap it again.
B indicates this item will be displayed in
Bold
.
A indicates this item will be displayed in Red.
2.
Tap
English
or
Metric
to switch the measurement unit.
3.
If the value of the data stream item is out of the range of the standard (reference) value, the whole line will
display in red. If it complies with the reference value, it displays in blue (normal mode).
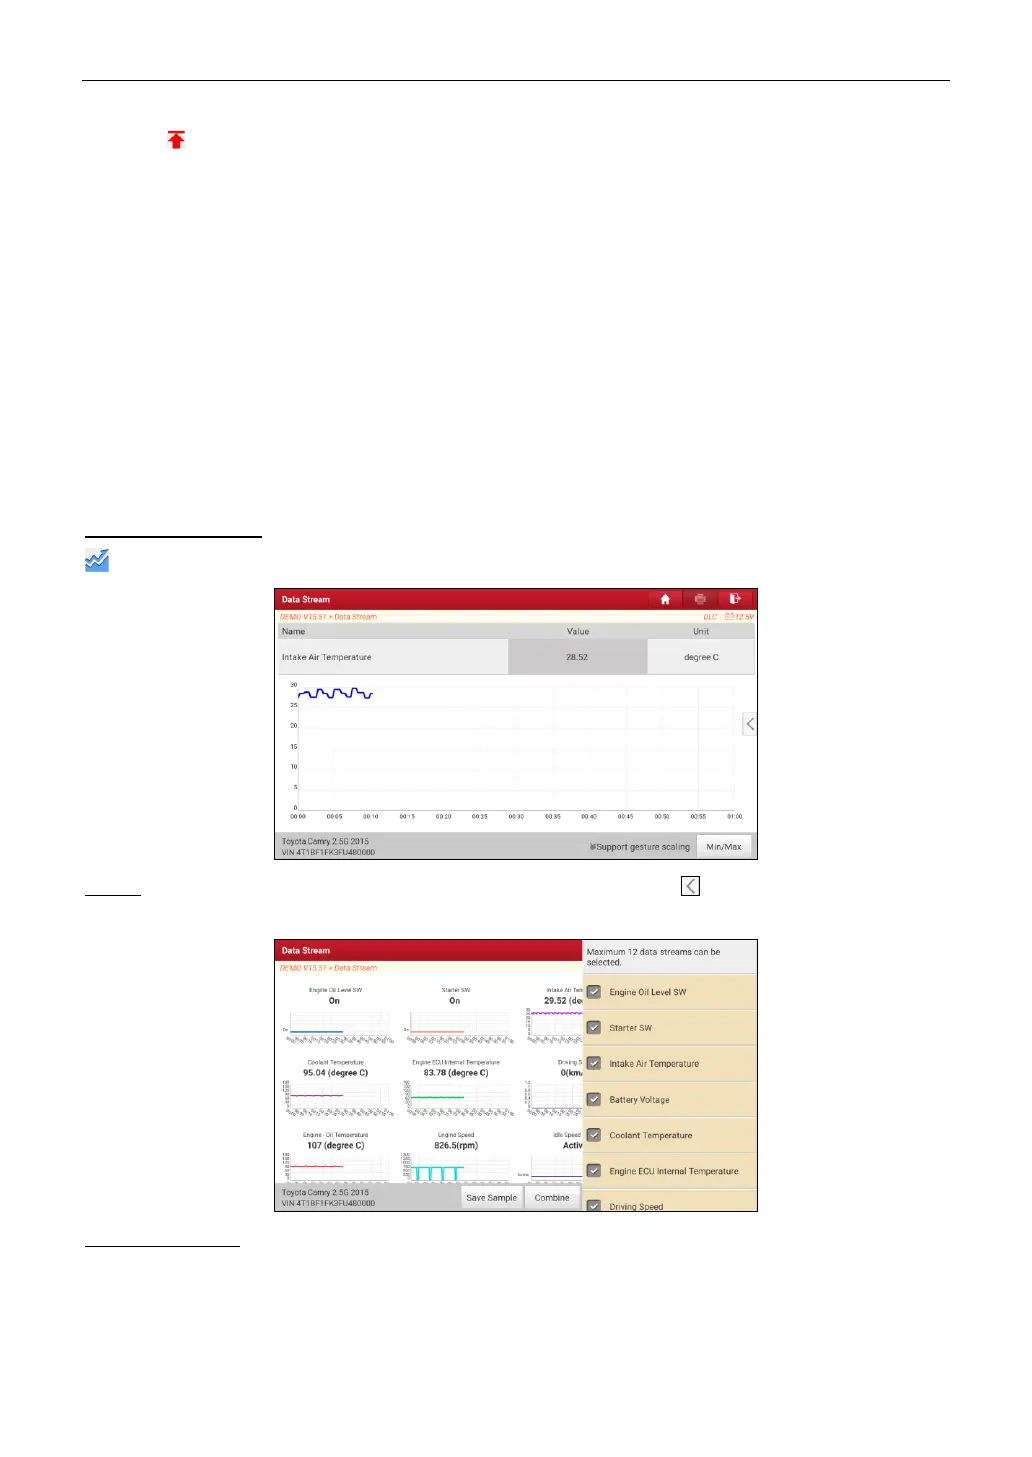
There are 3 types of display modes available for data viewing, allowing you to view various types of
parameters in the most suitable way.
Value – this is the default mode which displays the parameters in texts and shows in list format.
Graph – displays the parameters in waveform graphs.
Combine – this option is mostly used in graph merge status for data comparison.
In this case,
different items are marked in different colors.
On-screen Buttons:
: Tap it to view the live waveform.
Graph: Tap it to view the waveform of the selected data streams. Tap on the edge of the screen to
customize the target data streams for displaying.
Compare Sample: Tap it to select the sample data stream file, the values you customized and saved in
process of data stream sampling will be imported into the Standard Range column for your
comparison.
Note: Before executing this function, you have to sample the values of data stream items and save it as a sample
data stream file.