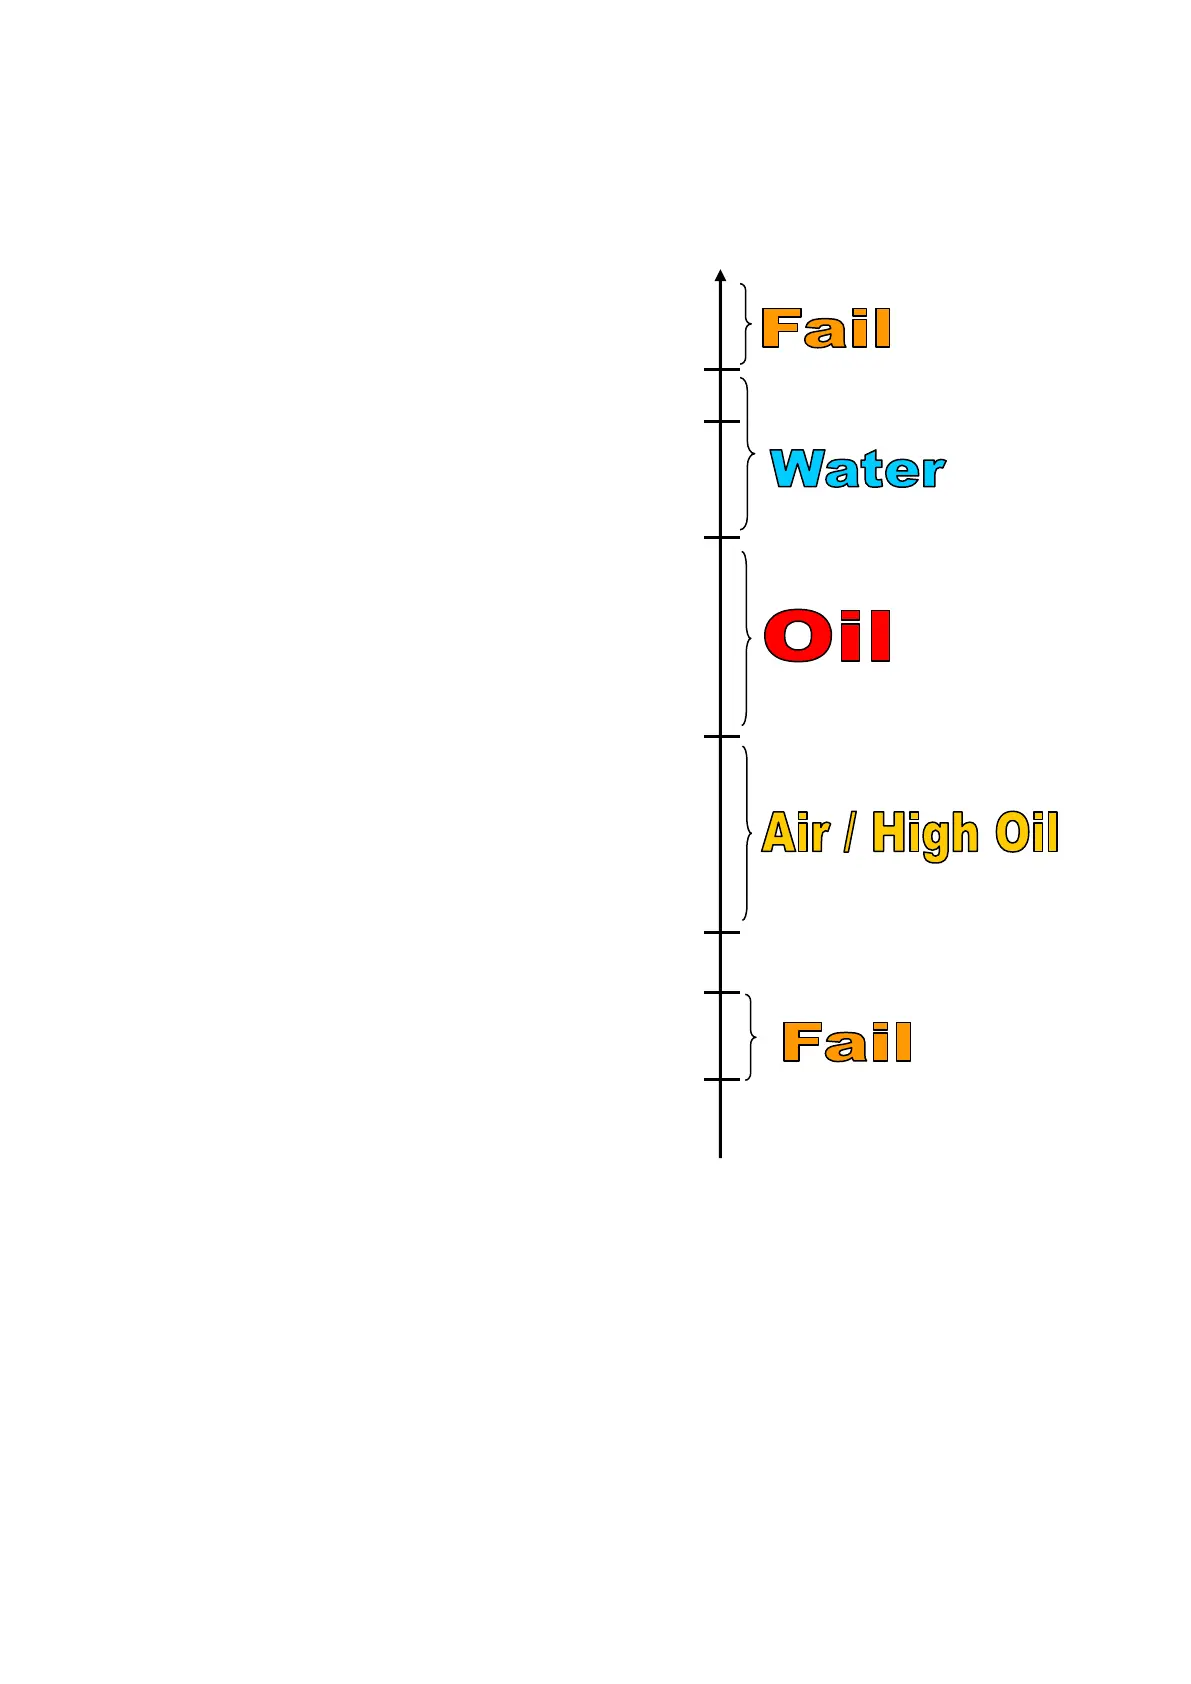
The following diagram reflects the relation between sensor output signal, calibration points, set-
points, and the status shown by the front panel lights. The signal values shown are typical
values for ID-221.
Set Points & Calibration Points (µA) Status
5000µA
Water Calibration Point (R5 Gain) 1100µA (3.50V at TP3)
Water / Oil Set Point (R1, TP1) 1070µA (3.40V at TP3)
Oil / Air Set Point (R2, TP5) 950µA (~1V at TP3)
Air Calibration Point (R3 Zero) 700µA (0V at TP3)
500µA
0µA
Notes:
1. Set Point values are shown in µA (sensor raw signal) and also as volts between TP3
and TP2. All voltages are in reference to TP2 (ground).
2. Signal decrease means a thicker oil layer.
3. Oil detection sensitivity is determined by the distance between Water Calibration Point
and Water / Oil Set Point. A larger distance means detection of a thicker oil layer (less
sensitivity).
4. Oil / Air Set Point can be set as an Air indication threshold or as a Second Oil Alarm
threshold. For Air indication set TP5 to 0.5V.