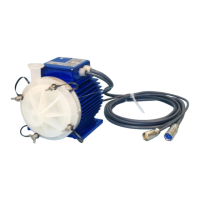
2.4 Pressure-Flow Curves
Figure 6: Pressure/flow curves for aqueous liquids
(Measured with pump-head DCP-2000.2)
The linearly increasing cavitation effects flows > 100 l/min and liquid temperature in the range of 90
0
C was
measured for water. This can be different for other liquids and depends on the hydraulic circuit design. For
example: higher inlet pressure reduces cavitation effects.
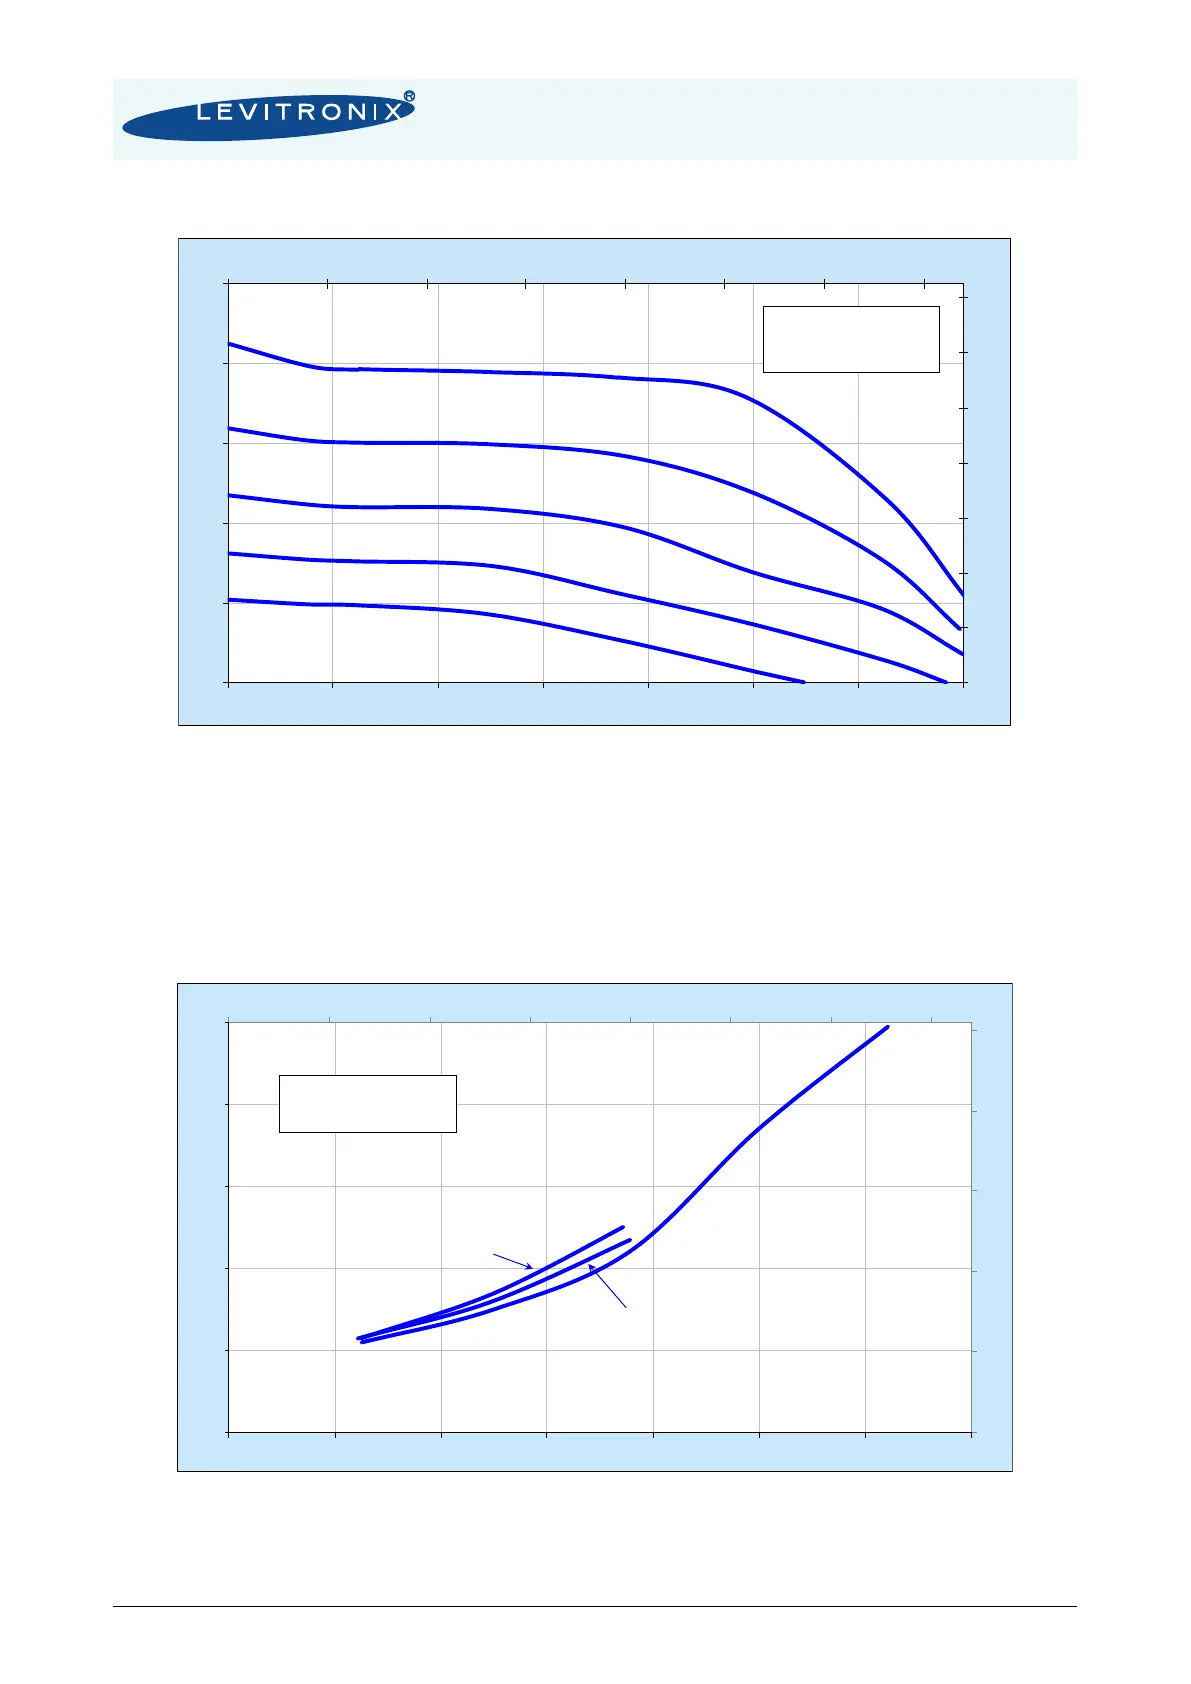
2.5 NPSHr Curves
Figure 7: NPSHr curves for “High Flow” pump head
(Measured with pump-head DCP-2000.2)