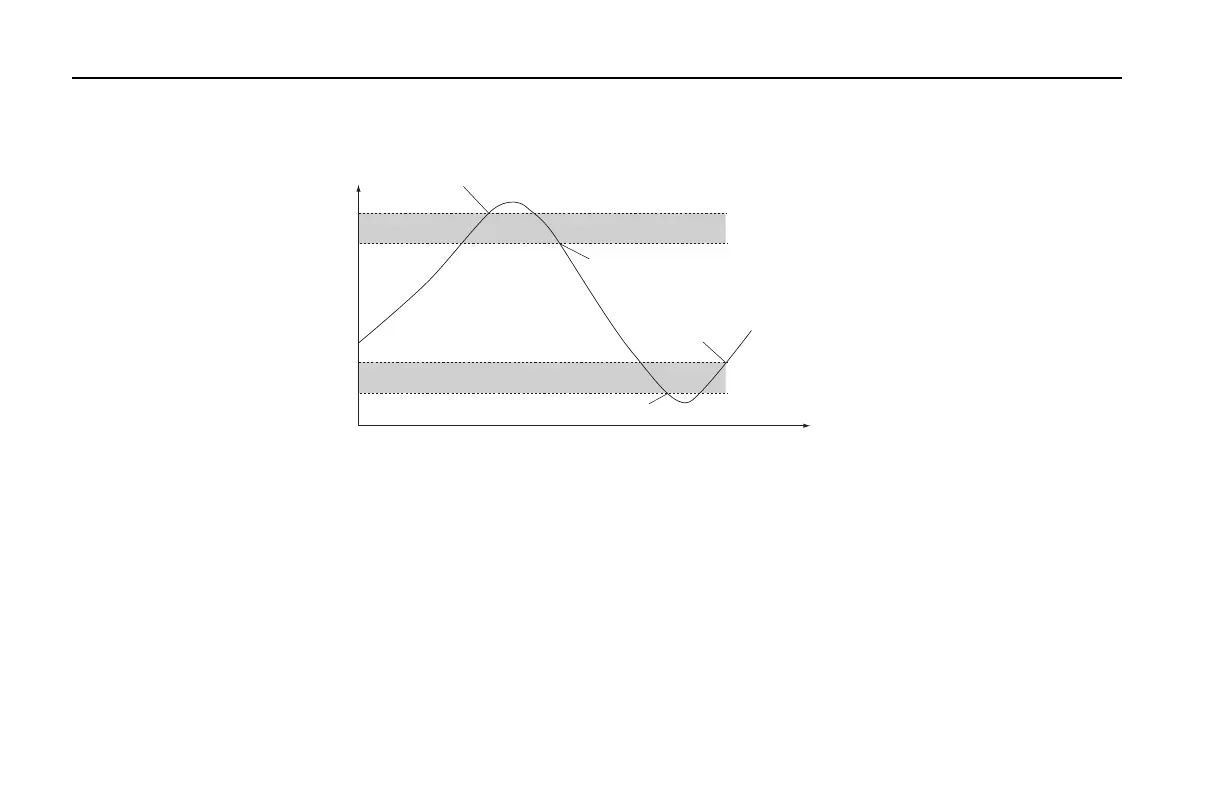
In addition, a "dead band" value can be set in software for both high and low alarms. To under-
stand how the alarms and dead band values work, look at the diagram below.
Elapsed Time
CO
2
Concentration, ppm
0
100
200
1000
900
Low Alarm = 100
High Alarm = 1000
High Alarm
activated
Low Alarm
activated
Low Alarm
deactivated
High Alarm deactivated
Dead Band = 100 ppm
Dead Band = 100 ppm
In this chart, the low and high alarm values are set to 100 ppm and 1000 ppm, respectively. The
dead band value in both alarms is set to 100 ppm. When the CO
2
concentration reaches 1000
ppm, the high alarm is activated, and remains active until the concentration drops below 900
ppm. When the CO
2
concentration falls below 100 ppm, the low alarm is activated, and remains
active until the concentration rises above 200 ppm. Your choice for the dead band value(s)
depends on your application and the fluctuation in CO
2
concentrations over time.
Section 2
2-4 Section 2. Power On
 Loading...