Appendix C—Performance Curves
1
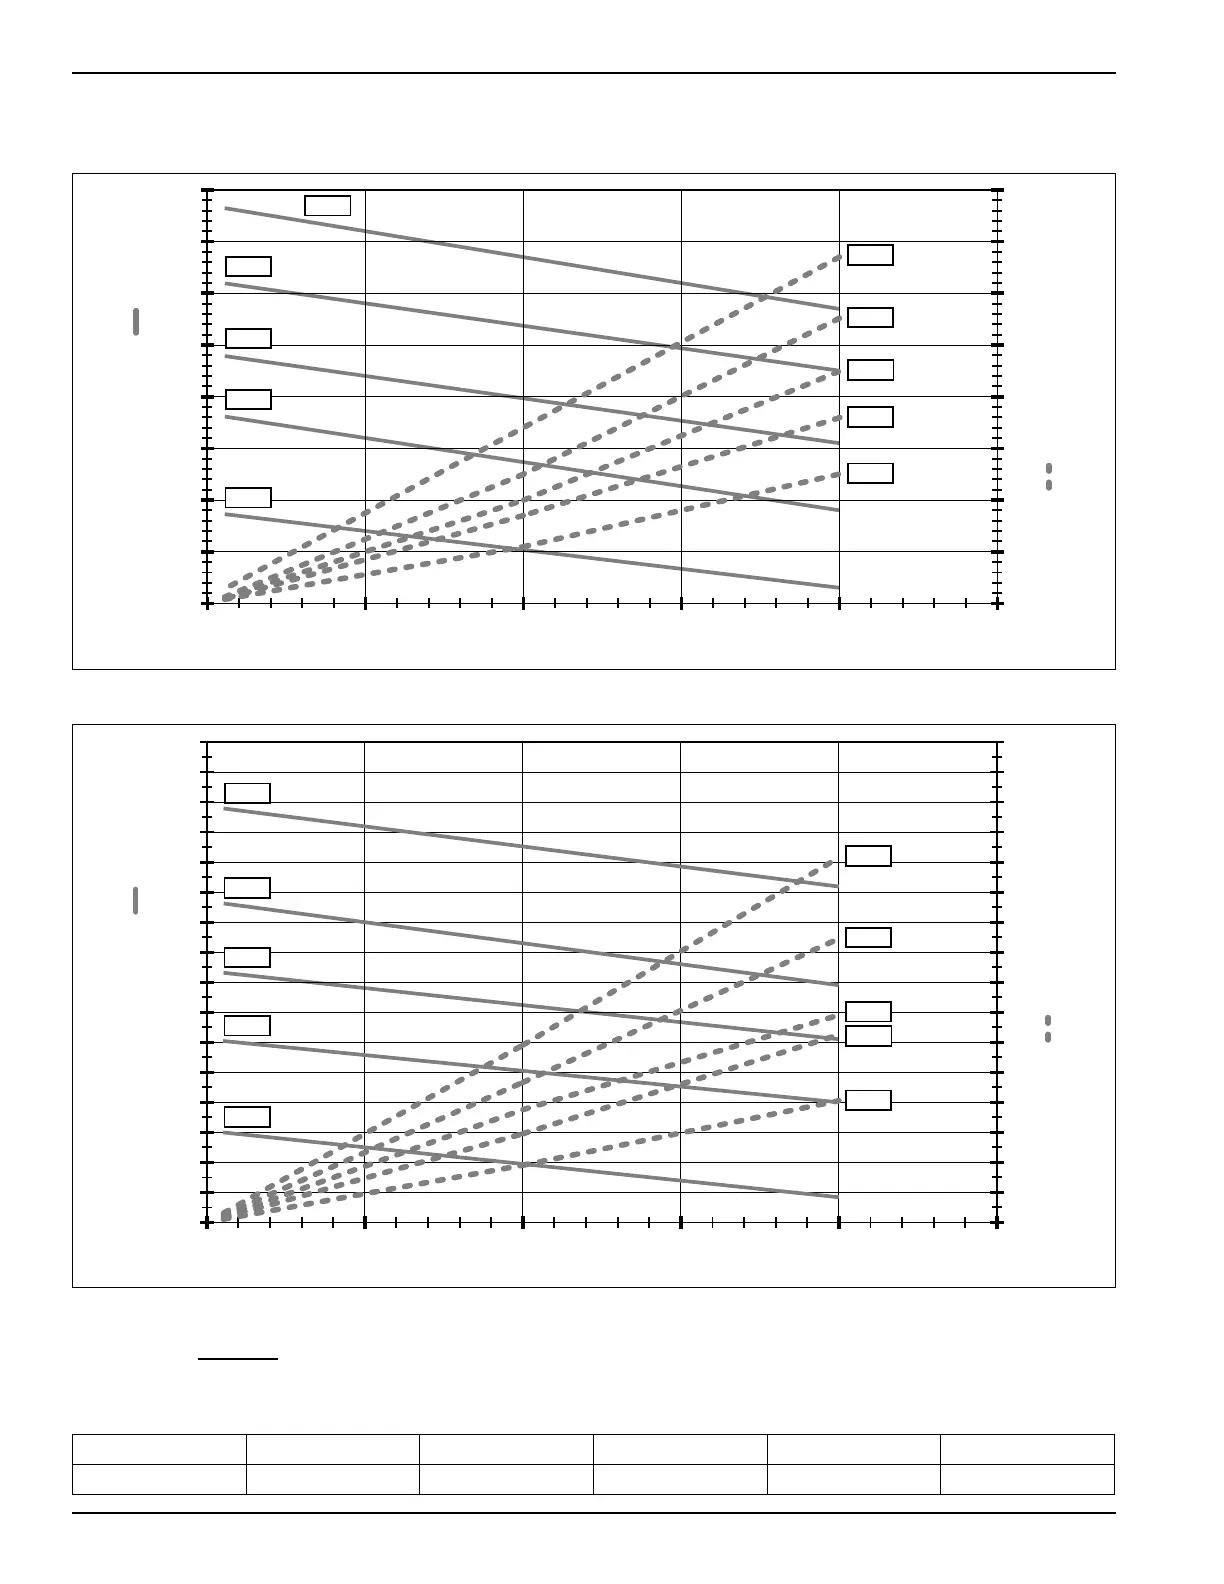
PT/PTH20 Pump
10
20
30
40
50
60
70
80
90
0
1
2
3
4
5
6
7
8
1251007550250
Differential Pressure (psi)
Capacity (gpm)
Horsepower (hp)
2
275
420
520
640
780
275
420
520
640
780
1
These curves depict performance of the PUMP ONLY. Performance will vary in applications due to system design and variables. Approximate
capacities and horsepowers are based on 30 SSU (3 cP) fluid.
2
Torque (in•lb) =
hp x 63025
RPM
PT/PTH25 Pump
20
30
40
50
60
70
80
90
100
110
120
130
140
150
160
170
180
0
1
2
3
4
5
6
7
8
1251007550250
Differential Pressure (psi)
Capacity (gpm)
420
520
640
780
Horsepower (hp)
2
420
520
640
780
275
9
10
11
12
13
275
14
15
16
Viscosity (SSU) 100 1,000 5,000 10,000 20,000
Maximum RPM 780 640 520 420 275
PT/PTH20 and PT/PTH25 Viscosity Chart
16
 Loading...