Operation Manual PILOT TEST
Results are displayed with:
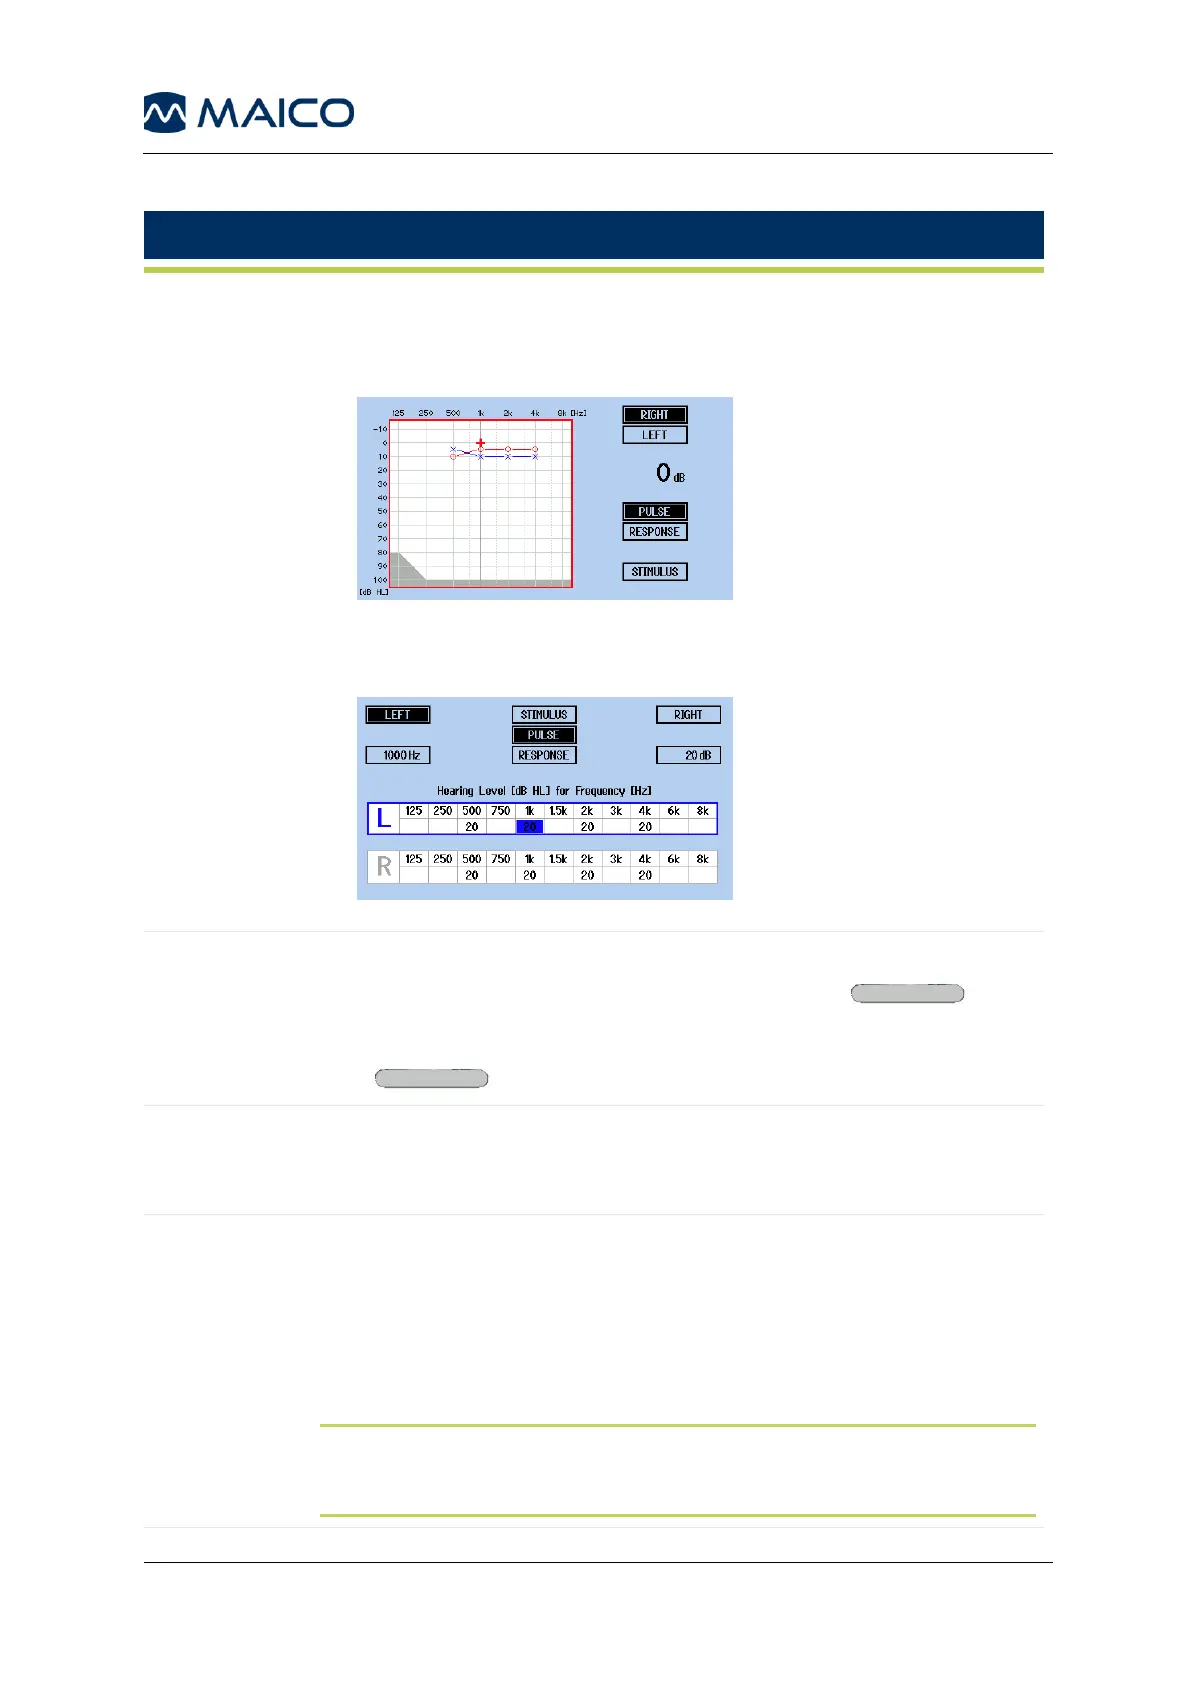
• Graph: The level and frequency of the response is highlighted by a
red O for the right ear and blue X for the left ear. The results are
connected by lines when octave frequencies are tested (Figure 21).
Figure 21
• Table: The response in the table view is stored as a numerical value
under the frequency and ear tested (Figure 22).
Figure 22
Selection of the operation mode:
• Presenter: Tone is presented when the Tone key is
touched.
• Interrupter: Tone is interrupted/stopped when the Tone
key is touched.
Frequency
change after
saving
When On, the next frequency is selected upon storing the result. If
this function is switched Off, the next frequency must be selected
by pressing the arrow keys.
Level after
frequency
change
Change to hearing level when frequency is changed.
• Remain: The hearing level does not change with the frequency change.
• Return to minimal level: The hearing level at the next frequency is -10 dB.
• Decrease by 30 dB: The hearing level at the next frequency
is decreased by 30 dB.
• Return to 30 dB: The hearing level at the next frequency is 30 dB.
NOTE: This setting also defines the start level with a new test. Remain
and Return to 30 dB start level is 30 dB HL. Return to minimal level
and Decrease by 30 dB start level is -10 dB HL.