Service Section 6
6-10
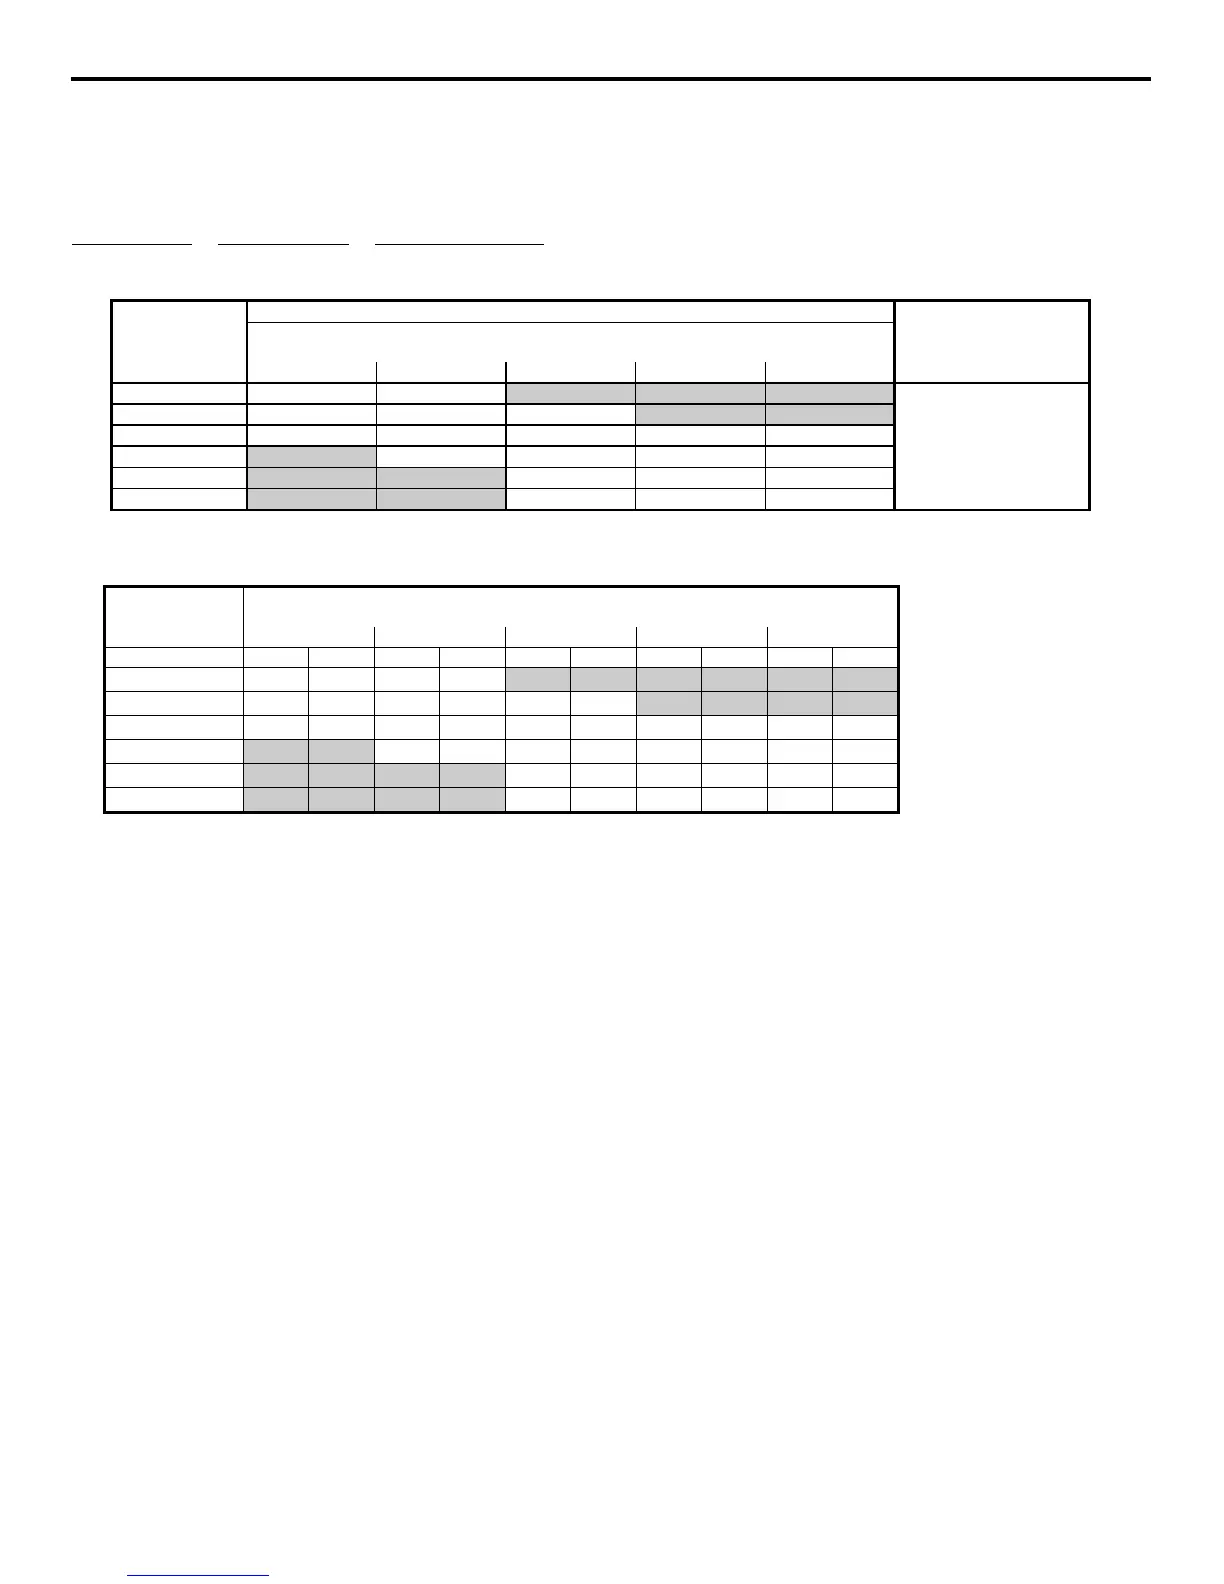
Cycle Times/24-Hour Ice Production Chart
These characteristics may vary depending on operating conditions.
Cycle Times Chart (Times are listed in minutes)
Freeze Time + Harvest Time = Total Cycle Time
The first cycle, at any temperature, will take up to three minutes longer
Air Temp. Freeze Time Harvest
Entering
Condenser
Water Temperature °
°°
°C/°
°°
°F
Time
°
°°
°C/°
°°
°F
10/50 20/68 30/86 35/95 40/104
20/68 7.6-11.1 8.2-11.9 -- -- --
25/77 7.9-11.5 8.6-12.4 10.2-14.6 -- -- 1.25-3.25
30/86 8.6-12.4 9.5-13.7 10.4-14.9 11.2-16.0 11.8-16.8
35/95 -- 10.4-14.9 11.8-16.8 12.4-17.6 13.1-18.6
40/104 -- -- 13.8-19.6 15.1-21.4 16.1-22.7
45/113 -- -- 17.2-24.2 18.4-25.9 19.8-27.8
24-Hour Ice Production Chart
Air Temp.
Entering
Water Temperature °
°°
°C/°
°°
°F
Condenser 10/50 20/68 30/86 35/95 40/104
°
°°
°C/°
°°
°F
kg lb kg lb kg lb kg lb kg lb
20/68 30 66 28 62 -- --
-- -- -- --
25/77 29 64 27 60 24 52
-- -- -- --
30/86 27 60 25 55 23 51
22 48 21 46
35/95 -- -- 23 51 21 46
20 44 19 42
40/104
-- -- -- -- 18 40 17 37 16 35
45/113
-- -- -- -- 15 33 14 31 13 29
Based on factory setting average ice slab weight of 200-275 g (0.44-0.60 lb.)