39
TABLE OF RELATIONSHIP BETWEEN WATER CONTENT
/
BODY FAT
PERCENTAGE AND HEALTH
After weighing/measuring, analyse the results according to the table below. The following
information should only be used for reference.
Age Fat (F)
Water
content (F)
Fat (M)
Water
content (M)
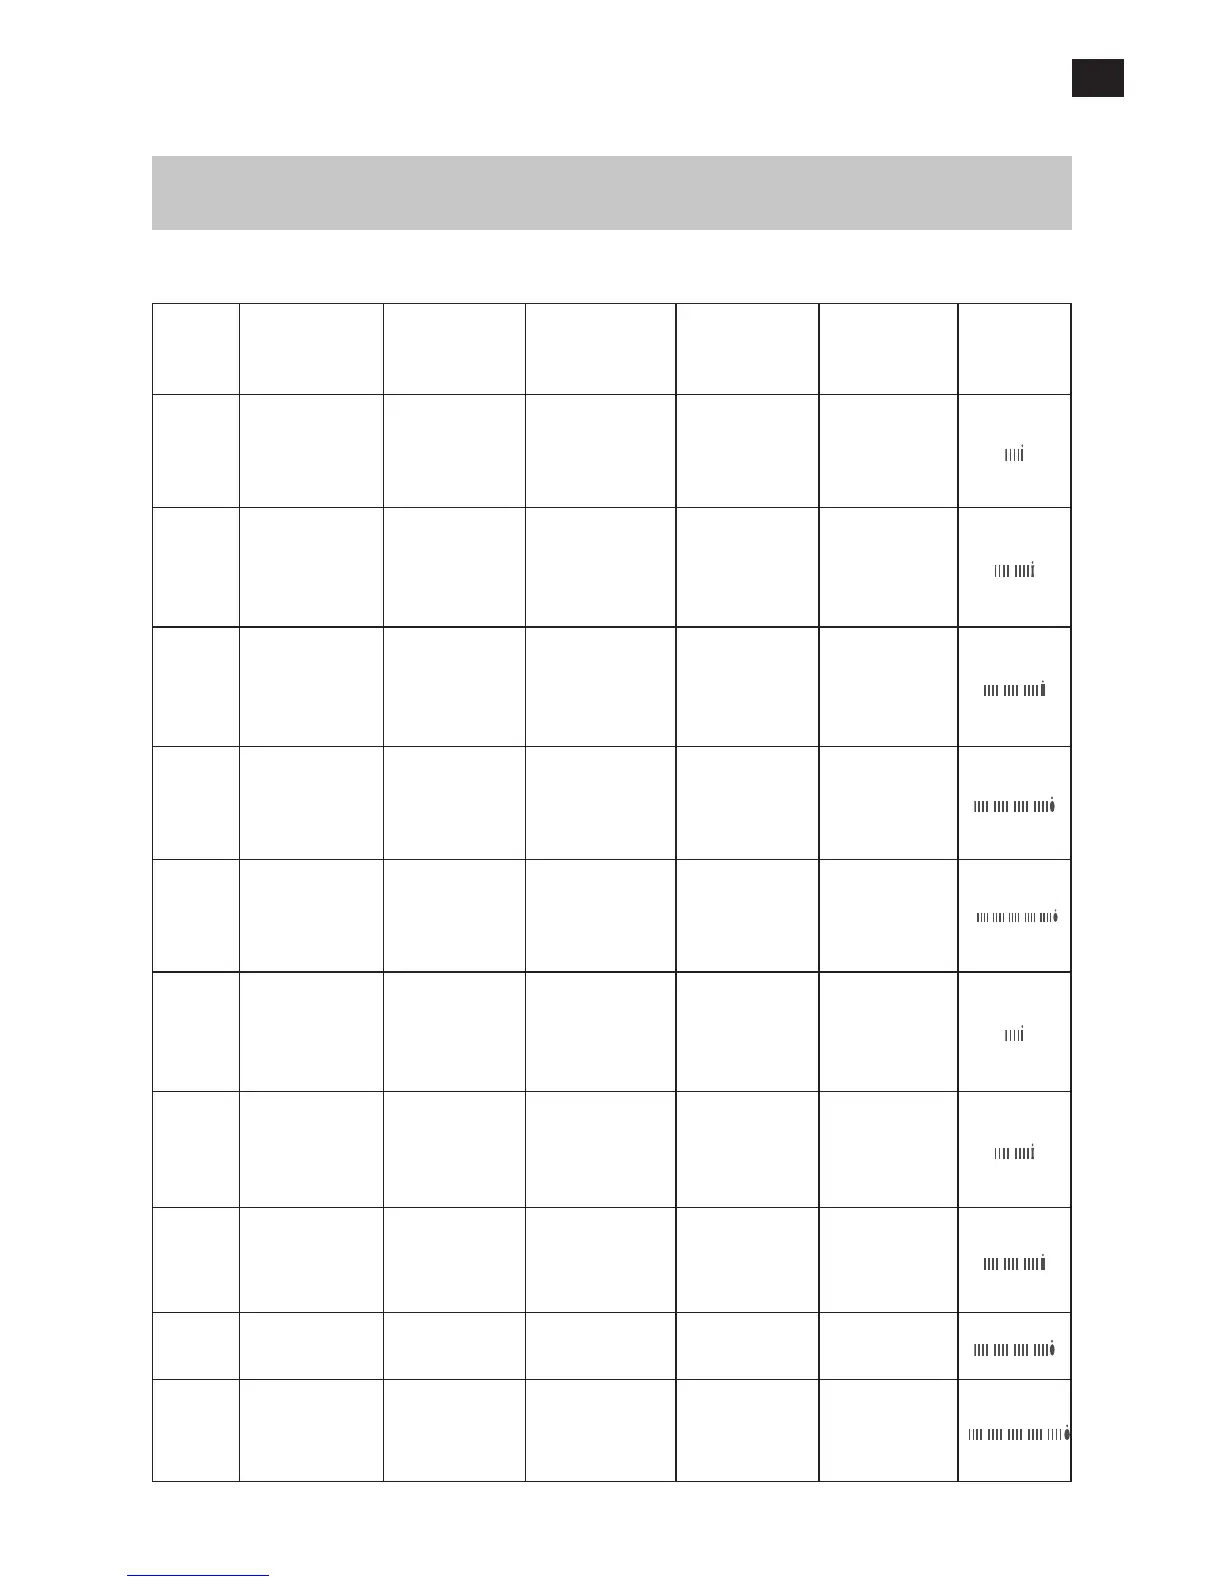
Status Indication
≤30 4.0–16.0% 66.0–57.8% 4.0–11.0% 66.0–61.2%
Unhealthy
underweight
-:- 16.1–20.5% 57.7–54.7% 11.1–15.5% 61.1–58.1% Underweight
-:- 20.6–25.0% 54.6–51.6% 15.6–20.0% 58.0–55.0%
Normal
weight
-:- 25.1–30.5% 51.5–47.8% 20.1–24.5% 54.9–51.9% Overweight
-:- 30.6–60.0% 47.7–27.5% 24.6–60.0% 51.8–27.5% Obesity
>30 4.0–20.0% 66.0–55.0% 4.0–15.0% 66.0–58.4%
Unhealthy
underweight
-:- 20.1–25.0% 54.9–51.6% 15.1–19.5% 58.3–55.3% Underweight
-:- 25.1–30.0% 51.5–48.1% 19.6–24.0% 55.2–52.3%
Normal
weight
-:- 30.1–35.0% 48.0–44.7% 24.1–28.5% 52.2–49.2% Overweight
-:- 35.1–60.0% 44.6–27.5% 28.6–60.0% 49.1–27.5% Obesity