e-Tracker portable energy monitor operating and maintenance manual
13
2.2 Graph
To show Deltrax5 data on a Graph you first need to select (highlight) a file in the File List box.
If you then use the File – Graph option from the menu, or click on the graphing icon (shown
above) then you will be shown the Date/Data selection options for the data that you want
to graph.
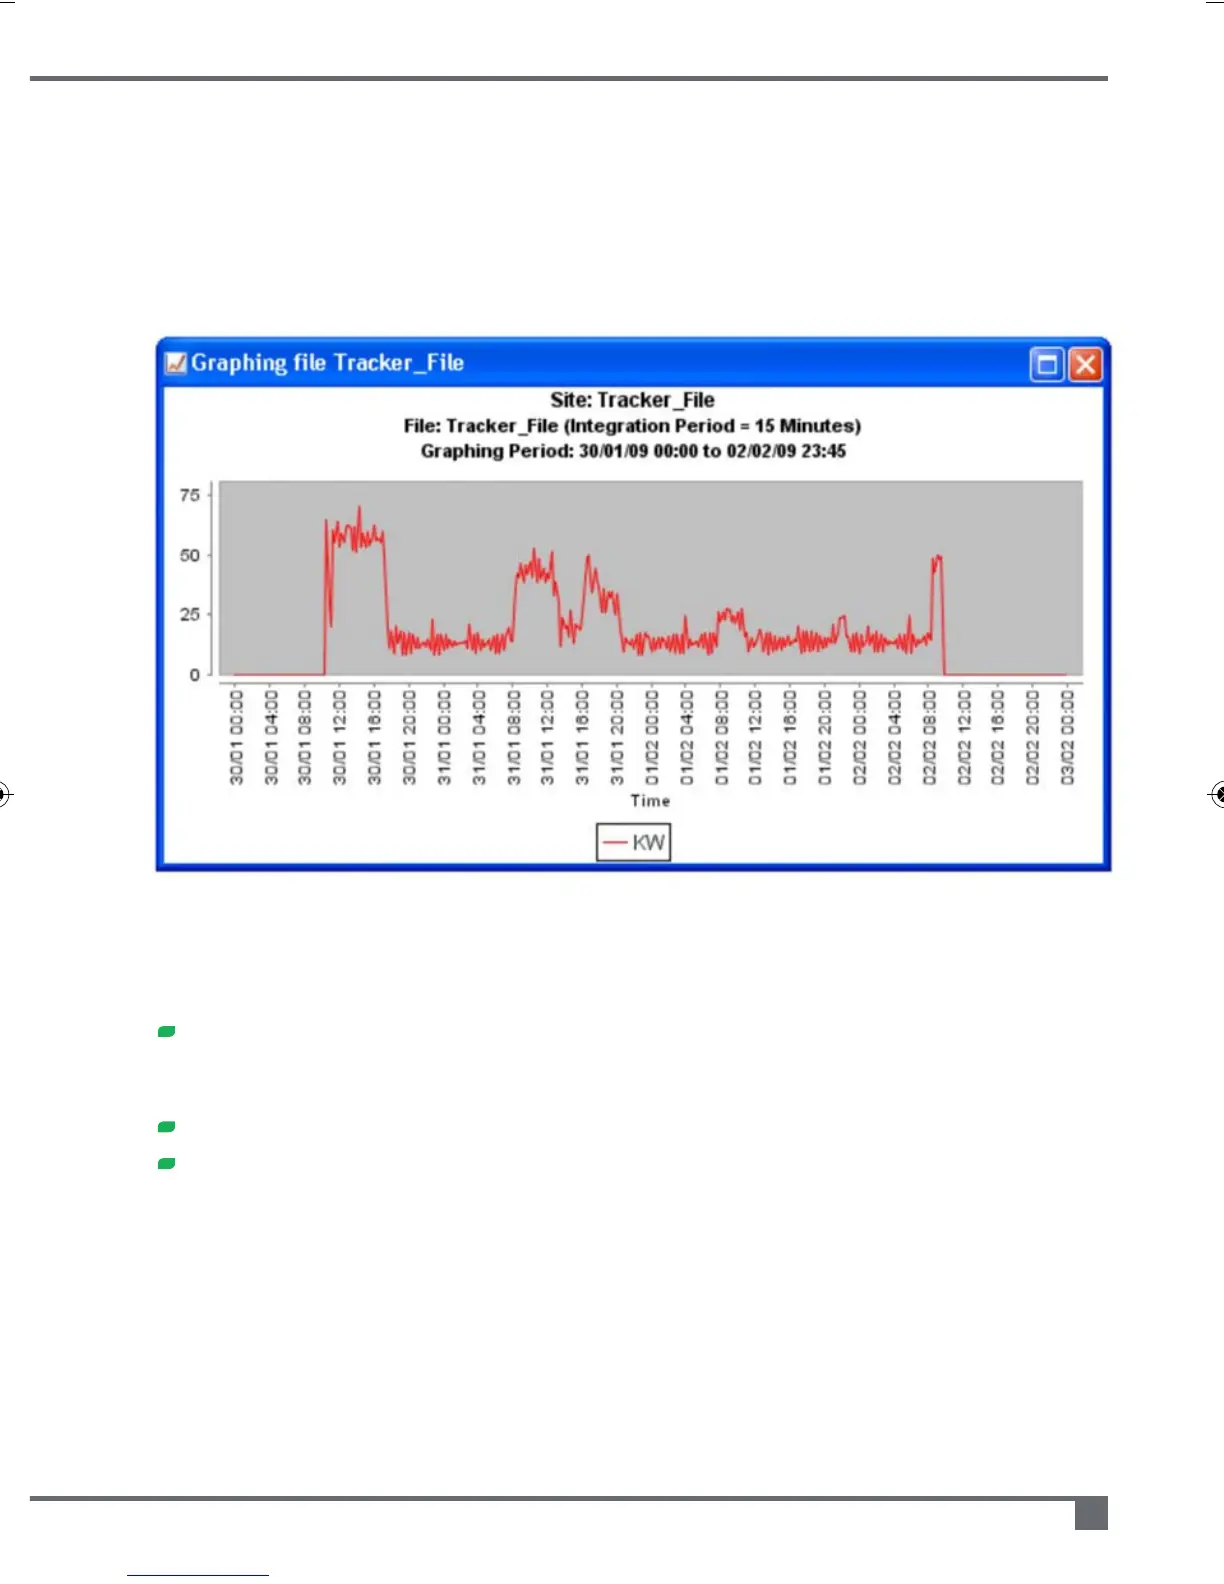
Once you have chosen the date/time and type of data that you want to see your graph
will be displayed on the screen.
Once the graph is displayed you have a number of options, you can:
Zoom in and out, draw a rectangle around the data you want to zoom in. Click
the mouse down at the top left of the rectangle, and release it at the bottom
right. To zoom out, click at the bottom right and release at the top left.
Hover over the line with the mouse pointer to get specific readings
Right click anywhere on the graph for more options, including printing
UsethePreferences–GraphPreferencesmenuitemtocustomizeyourgraph(please
refertoThepreferencesmenuonpage15).