20
Chart A. Temperature/Resistance Characteristics (-50 to 80
o
F)
Temp.
o
F Temp.
o
C ohms*1k Temp.
o
F Temp.
o
C ohms*1k
-50 -45.6 43.45 15 -9.4 7.579
-40 -40.0 32.31 20 -6.7 6.731
-35 -37.2 27.96 25 -3.9 5.993
-30 -34.4 24.27 30 -1.1 5.349
-25 -31.7 21.13
32 0 5.123
-20 -28.9 18.43 35 1.7 4.781
-15 -26.1 16.12 40 4.4 4.281
-10 -23.3 14.13 50 10.0 3.454
-5 -20.6 12.42 60 15.6 2.805
0 -17.8 10.94 70 21.1 2.294
5 -15.0 9.651 80 26.7 1.888
10 -12.2 8.544
NOTE: Use resistance at 32
o
F for sensor checking.
Pressure Transducer
Your Master Controller 2.0 will be equipped with one of two types of pressure transducer (PT). The difference
is in the color of sensor wires as noted below:
New PT (19-14226, 19-14223) OLD PT (19-13955, 19-14092) Description
RED BLACK +VDC (+5)
GREEN WHITE SIGNAL (sig)
BLACK GREEN GROUND (5-)
The GROUND is connected to terminal ‘5-‘ on the board. The SIGNAL lead is connected to terminal ‘sig’ on the
b
oard. The +VDC lead is connected to terminal ‘5+’ on the board. Chart B shows the characteristics of the
pressure transducer. NOTE: The pressure transducer cannot be repaired but replaced only.
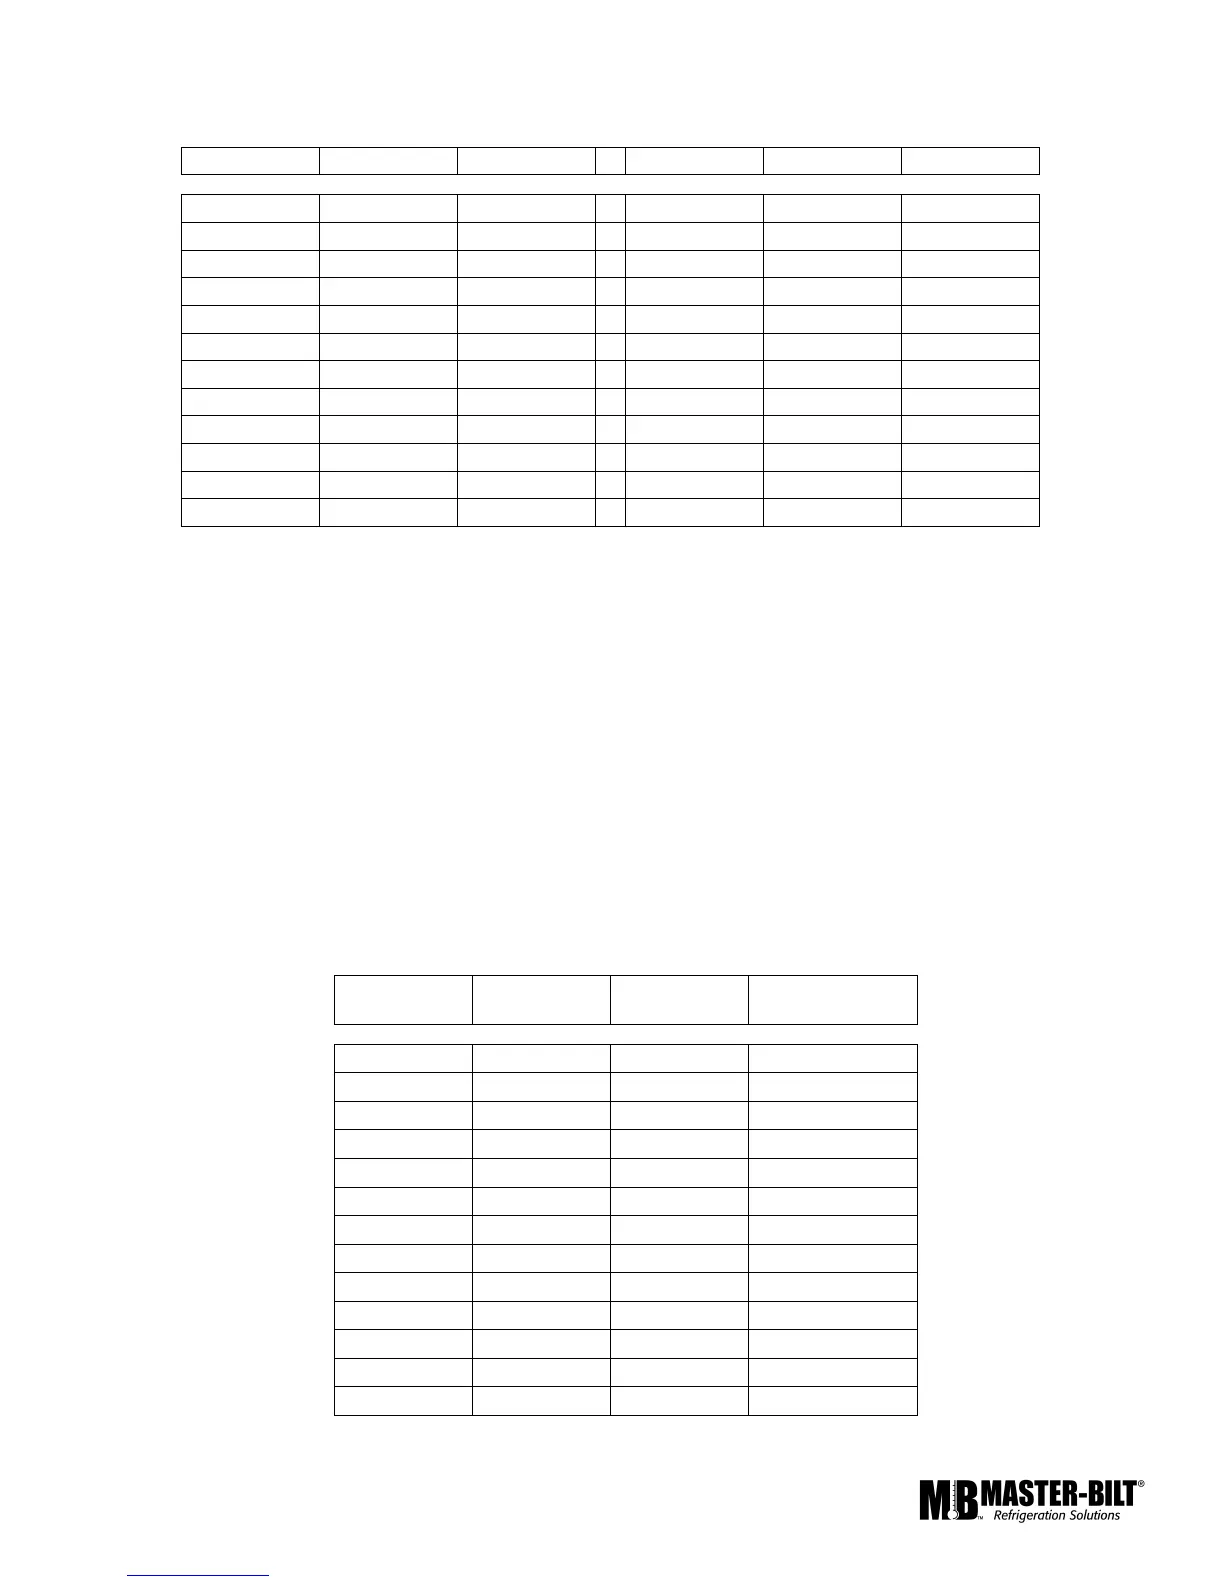
Chart B. Pressure Sensor Simulation Values ( 0 to 150 PSIA)
Bar PSIA
PSIG
V
(Signal to Ground)
0 0
-14.6
0.509
0.69 10
-4.6
0.784
1.379 20
5.4
1.058
2.069 30
15.4
1.332
2.758 40
25.4
1.587
3.448 50
35.4
1.862
4.137 60
45.4
2.136
4.827 70
55.4
2.391
5.516 80
65.4
2.665
6.206 90
75.4
2.920
6.895 100
85.4
3.194
7.585 110
95.4
3.469
8.274 120
105.4
3.724