þ
þ
þ
energy
bulbs
.co.uk
Mon-Fri: 8:30am - 6:30pm | Sat & Sun: 11am - 5pm
0800 043 8978
or
0121 250 2180
Quick Order Hotline
Guaranteed Low Prices
Huge Stock Available
Mastervolt Stockist
OPERATION
October 2011 / Sunmaster XS4300-3200-2000 / EN
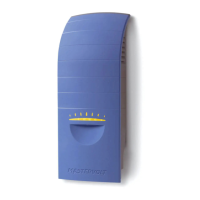
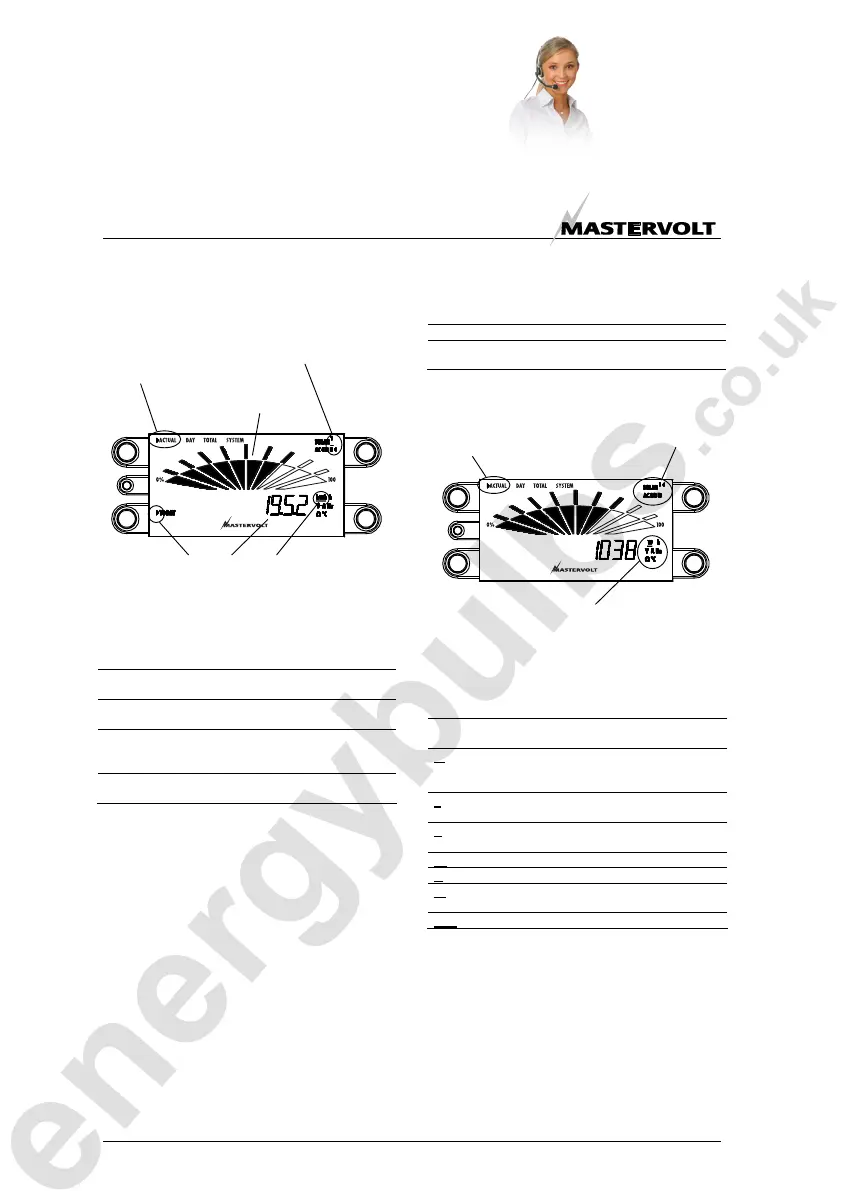
See figure 5-2. This screen is shown after start-up. Also if
no key was touched for 60 seconds, the display returns to
this screen. It shows:
• Actual solar power by means of a 0-100% bar
• Energy generated today.
Figure 5-2: initial screen (displayed values may differ)
By pressing S1: Menu you can toggle between:
►ACTUAL
Read out of measurements at this
moment; see chapter 5.3.1
►DAY
Showing the historical data of today and
1…30 days ago; see chapter 5.3.2
►TOTAL
This shows the total energy revenue at the
Solar input and the AC-output; see chapter
5.3.3.
►SYSTEM
Used to display system information about
the Sunmaster; see chapter 5.3.4.
5.3.1 Actual readings
When [►ACTUAL] is highlighted at the LCD-display,
actual readings of the Sunmaster are shown (figure 5-3).
By pressing S2: Source you can toggle between:
SOLAR 1 ◄
Data measured at DC-input “SOLAR1”
AC GRID ◄
Data measured at the AC-output of the
Sunmaster
Figure 5-3: Actual readings
Press S4: Select to navigate through the actual data. The
table below explains the meaning of the displayed data:
Selected source =
AC GRID
Selected source =
SOLAR1
W
Power supplied to the
AC grid
Solar power supplied to
the Sunmaster by the
PV-strings
V
AC grid voltage DC Voltage from the
PV-string
A
AC current supplied to
the AC grid
DC current from the
PV-string
Hz
AC grid frequency n/a
Ω
AC grid impedance* n/a
°C
Internal temperature of
the inverter
Internal temperature of
the inverter
kWh
Energy generated today n/a
* ENS-models only (see chapter 3.2), else 0.00 is shown.
Actual readings are shown
Press S2: Source to toggle between
SOLAR 1
AC GRID
S3
S4
Press S4: Select to toggle between
[W], [V], [A], [Hz], [Ω], [°C] and [kWh]
actual solar power
(approx. 70% of nominal power)
Today’s energy so far
Example: 19.52 kWh
actual values are shown
Data of the AC grid is shown
S1 S2
S3
S4