25
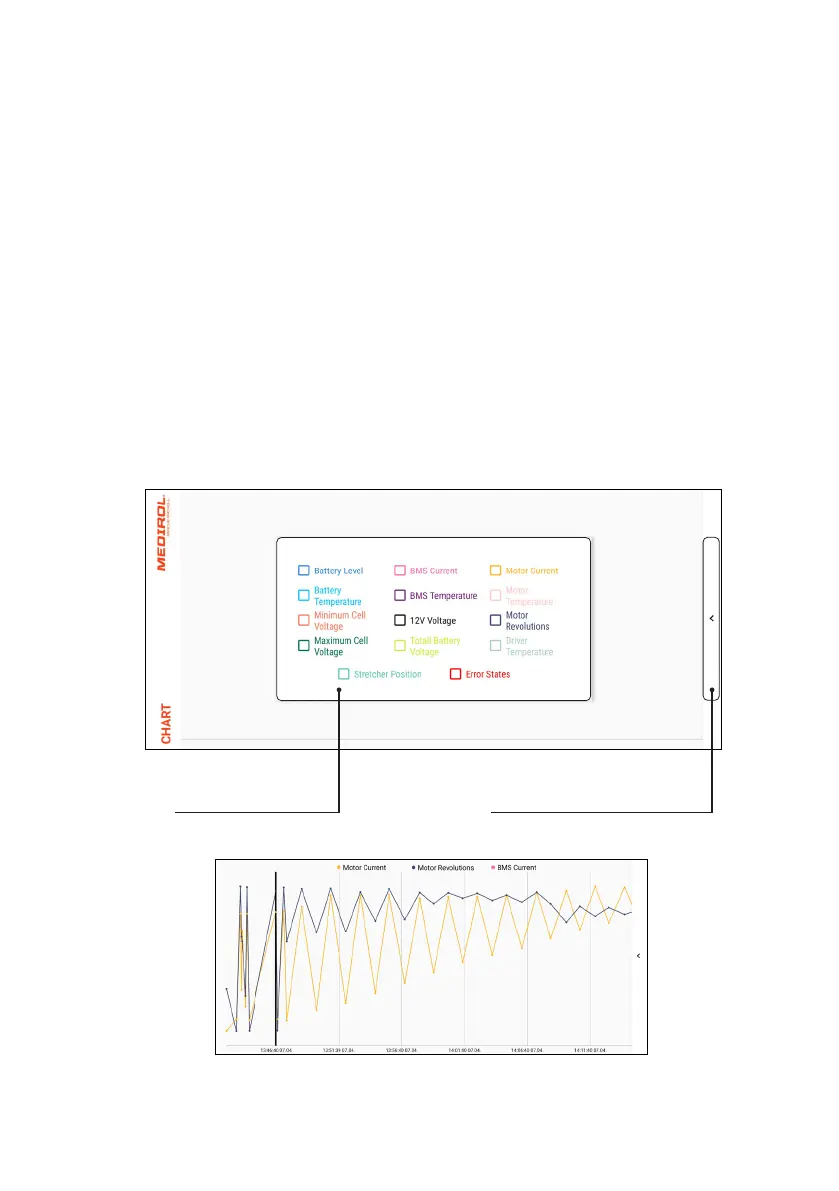
Graph
Used to display the recorded data needed for diagnostics.
Procedure to view the graph:
1. Download the CSV data and save it; see chapter “Home Screen” on p. 12.
2. Open the graph output values display.
3. Select the information you want to display.
4. Close the graph output values display.
Selection of the
graph output values
Button to display the
graph output values
Example of a generated graph