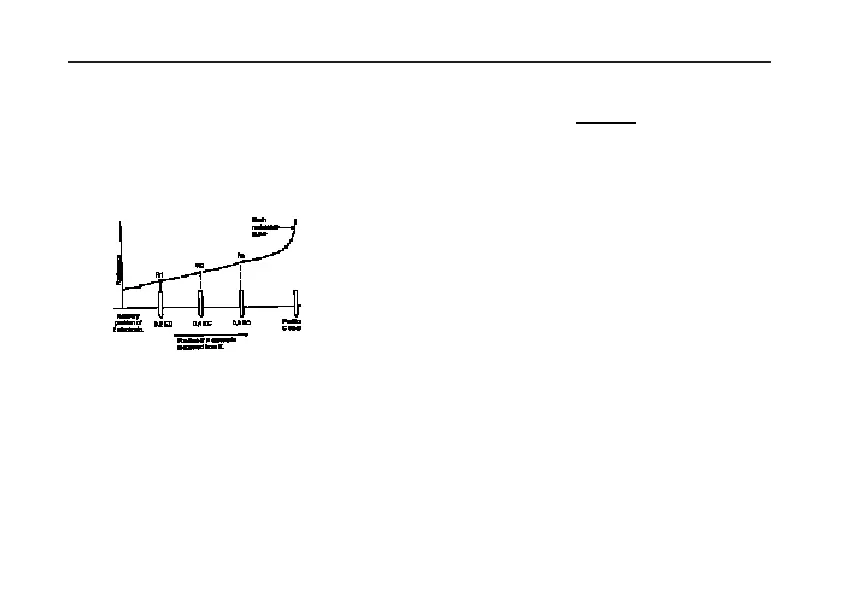
The earth resistance is measured at each separate
position of the Potential spike and the resistance curve
is plotted from the results. At least six readings are
needed. The diagram of Fig. 12 shows an example.
Drawing the curve will show up any incorrect points
which may be either rechecked or ignored.
Fig. 12 Resistance curve from Slope method tests.
Suppose the distance from the earth electrode system
to the current spike is
EC. From the curve equivalent
resistance readings to Potential positions 0,2
EC,
0,4
EC and 0,6 EC can be found. These are called R1,
R2 and R3 respectively.
Calculate the slope coefficient µ, where
µ= (
R3-R2
)
(R2-R1)
which is a measure of the change of slope of the earth
resistance curve.
From the table on page 35 obtain the value of
P
t
/ Ec
for this value of µ.
P
t
is the distance to the Potential electrode at the
position where the ‘
true’ resistance would be
measured.
Multiply the value of
P
t
/ Ec by Ec to obtain the
distance
P
t
.
From the curve read off the value of resistance that
corresponds to this value of
P
t
. The value obtained is
the earth electrode system's resistance.
Note:- (i) If the value of µ obtained is not covered in
the table then the current spike will have to be moved
further away from the earthing system.
(ii) If it is necessary, further sets of test results
can be obtained with different values of
EC, or different
directions of the line of
EC. From the results obtained
of the resistance for various values of the distance
EC
19