5-112 Image Optimization
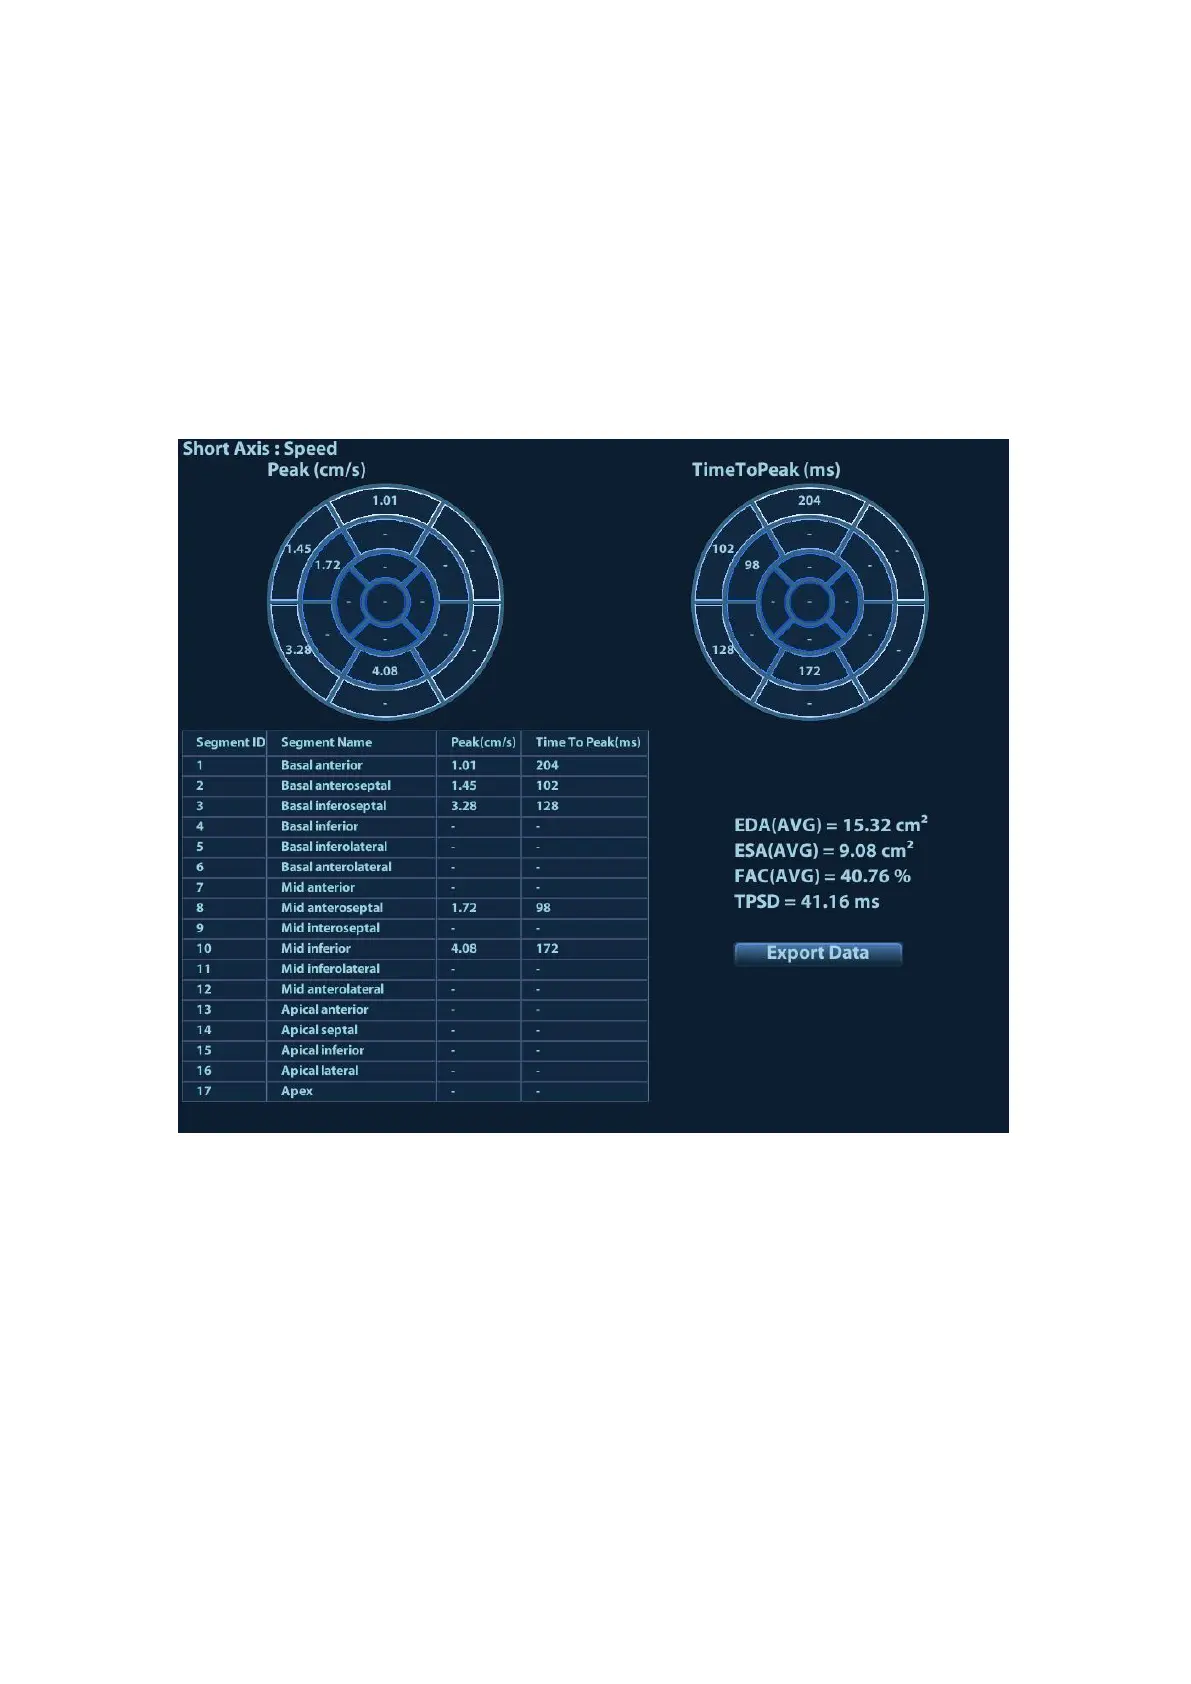
5.15.6 Bull’s Eye Display
After tracking, the system can display Bull’s Eye graph, for judging the reverse movement or scope
of myocardium.
1. Touch [Bull’s Eye] on the touch screen to turn on the function:
You can acquire:
Time to peak value and peak value of the 17 segments;
Display measurement result EDV/ ESV/ EF/ TPSD.
2. Rotate the knob under [Parameter] on the touch screen to see different parameter bull’s eye
graph.
"-" will display in the table to indicate those segments that are not well tracked.
5.15.7 Measurement/ Comment
Under tissue tracking QA mode, only Time measurement is available. For details, please refer to
Operator’s Manual [Advance Volume].
Comments and Body Mark operations are the same as in other modes.
5.15.8 Data Export
The system provides data exporting function, so that you can export calculation result for analysis
(for instance, SPSS analysis).
Touch [Data Export] on the touch screen, to export analyzed data of each segment in .csv format.