5-108 Image Optimization
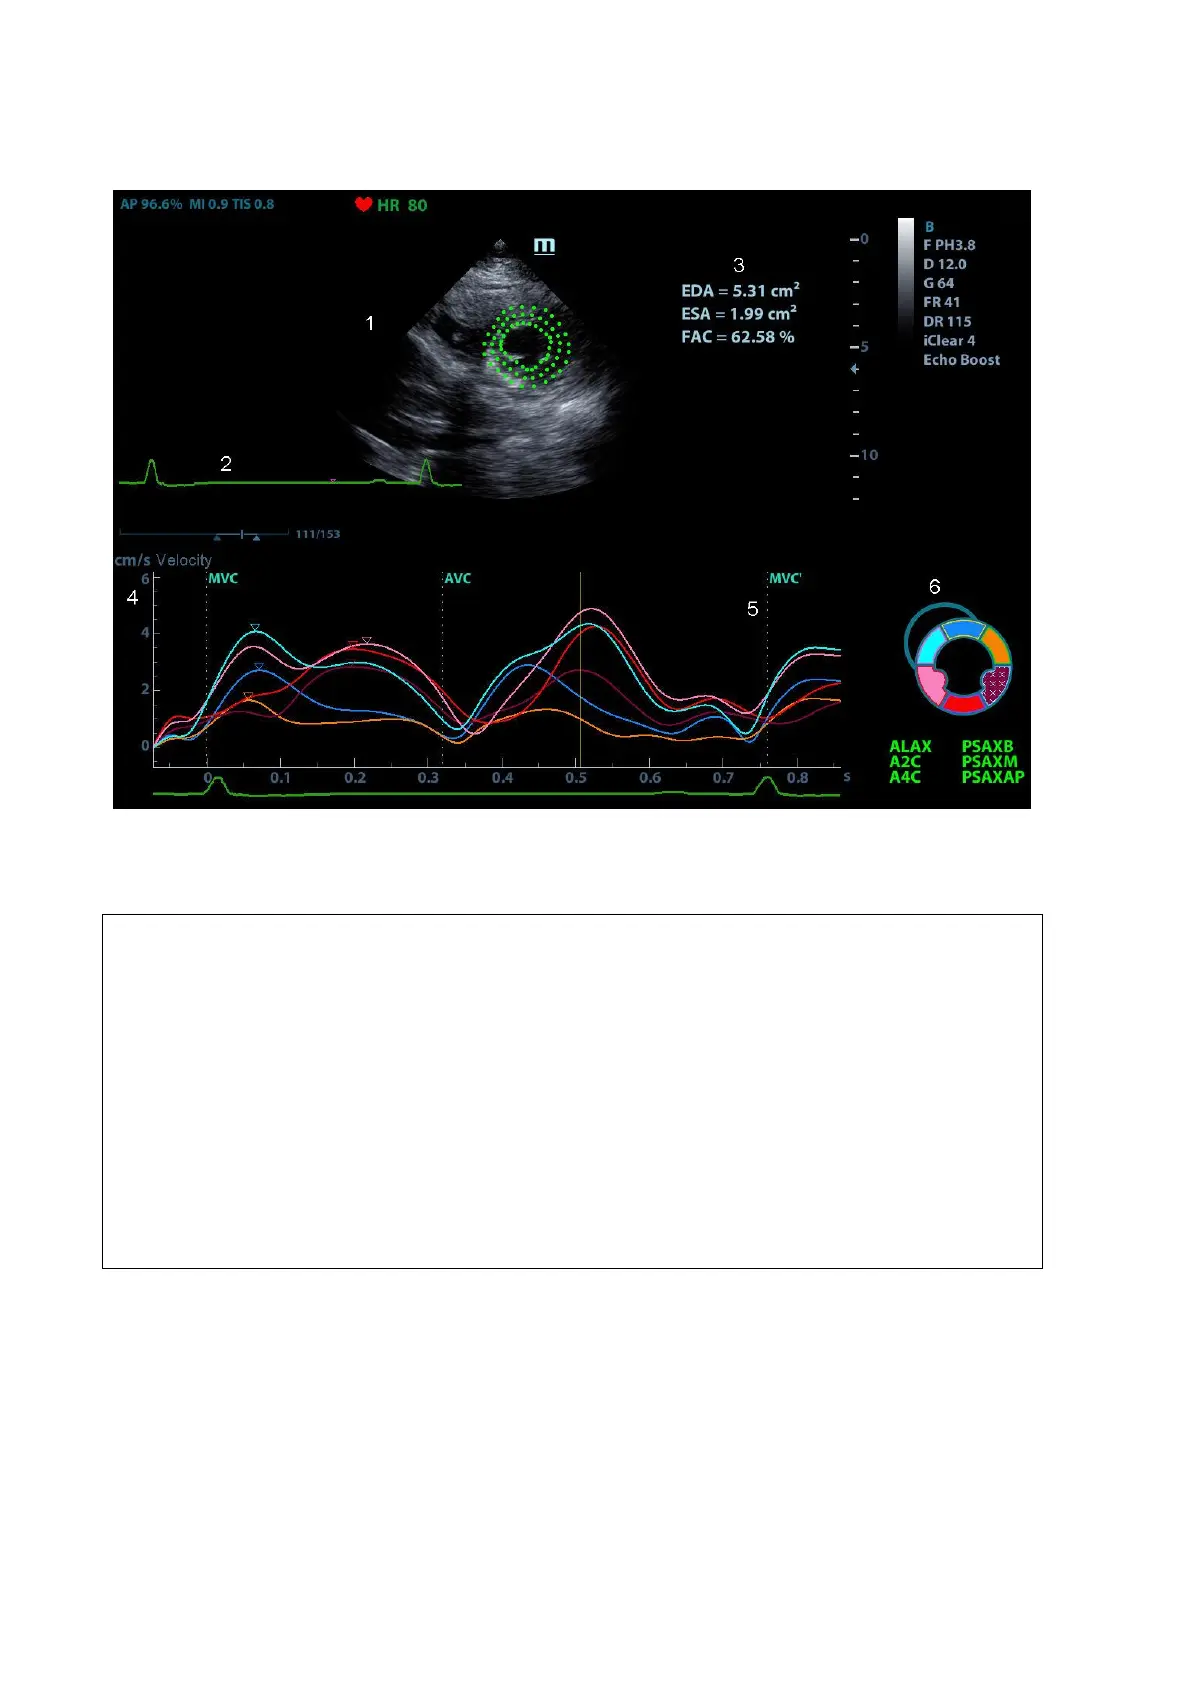
5.15.2 Tissue Tracking QA Screen Description
1—Displays image used to generate trace curve
2—Displays ECG trace
3—Displays measurement and calculation results:
maximum value of the end diastolic volume during the trace.
maximum value of the end diastolic area (Left Ventricular) during the trace.
maximum value of the end systolic volume (Left Ventricular) during the trace.
maximum value of the end systolic area (Left Ventricular) during the trace.
Fractional Area Change= (EDA — ESA)/EDA.
This parameter is available under short axis section.
Ejection fraction.
This parameter is available under long axis section.