Part I Service Scenarios
Maintenance 65
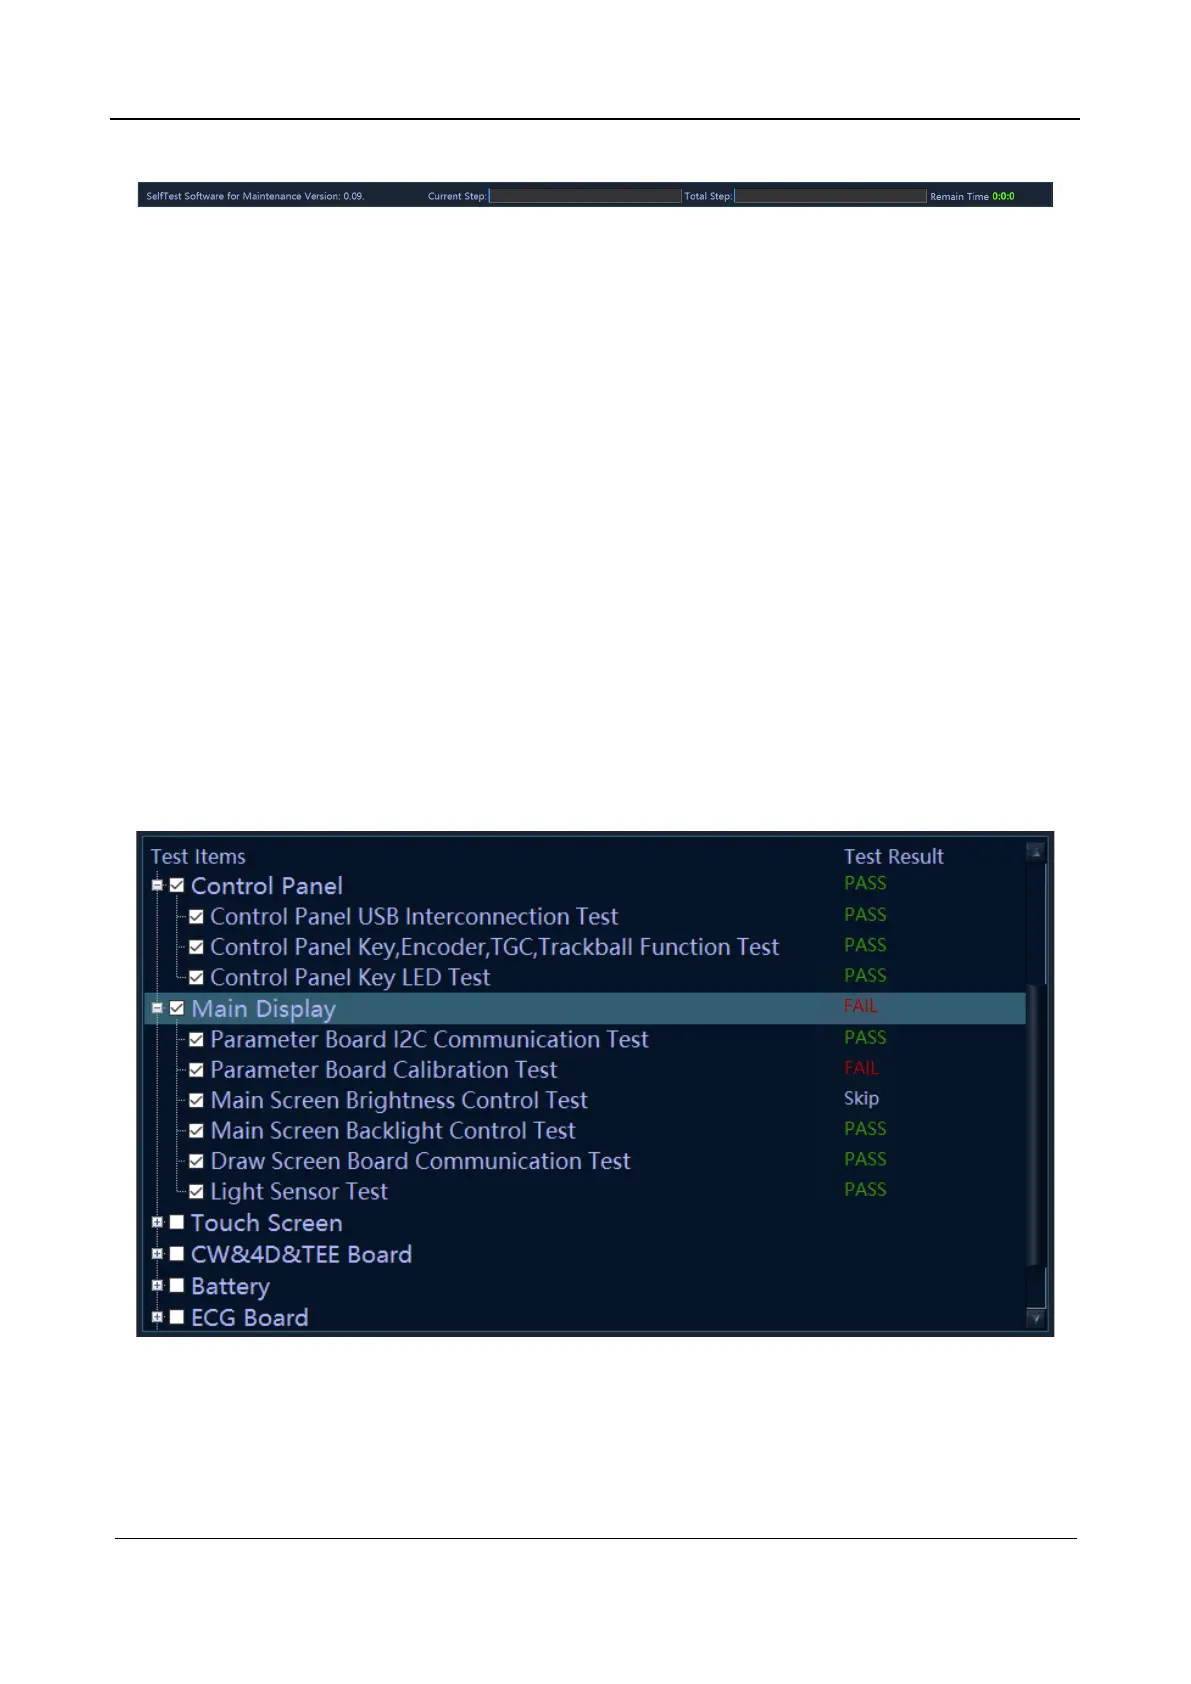
Figure 2-4 Sketch map of the status bar
6. Monitoring information bar
The monitoring information bar shows the current time, CPU usage, memory usage, CPU
temperature, and FGPA junction temperature in real time. The value ranges of the CPU
temperature and FPGA junction temperature are displayed in white.
When the actual temperature exceeds the operating temperature range, the temperature appears in
red on the status bar.
7. System block diagram
The color of the element in the system block diagram changes as the color of test result changes in
the test process. If the test fails, the element becomes orange; if the test succeeds, it becomes green.
If the color of the element keeps the same, it indicates the test is not proceeded.
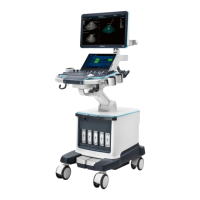
8. Test information
The test result is displayed behind each test item. The test result is marked as PASS in green for a
passed sub-test item, and as FAIL in red for a failed sub-test item. If a test item is not performed, it
is marked as Skip in gray. If the board or component is not in position, the test item is marked as
NaN in gray. If an error occurs during the test, the test item is marked as Error in red. The test
result of a parent test item is the summary of the test results of all selected sub-test items. If the test
result of any selected sub-test item is FAIL, the test result of the parent test item is FAIL. The test
result of a parent test item is marked as PASS only if the test results of all sub-test items are PASS.
See the following figure.
FIG 2-5 Test results
Click a test item and the test program will automatically index the test result of this test item and
display the test result in the Messages table, as shown in the following figure.