NV10/NV7.5 Operations and Maintenance Manual Operating the transmitter
Page 2-40 Issue 3.4 2016-08-03
Touch on the panel to display a cursor in the approximate area. The cursor position (Gain and
LUT index) is noted in the upper, right-hand corner of the panel. Touch in other areas of this
instrument panel to provide a coarse adjustment of the cursor position. Use the left/right fine
adjustment buttons and the maximize/minimize buttons as required.
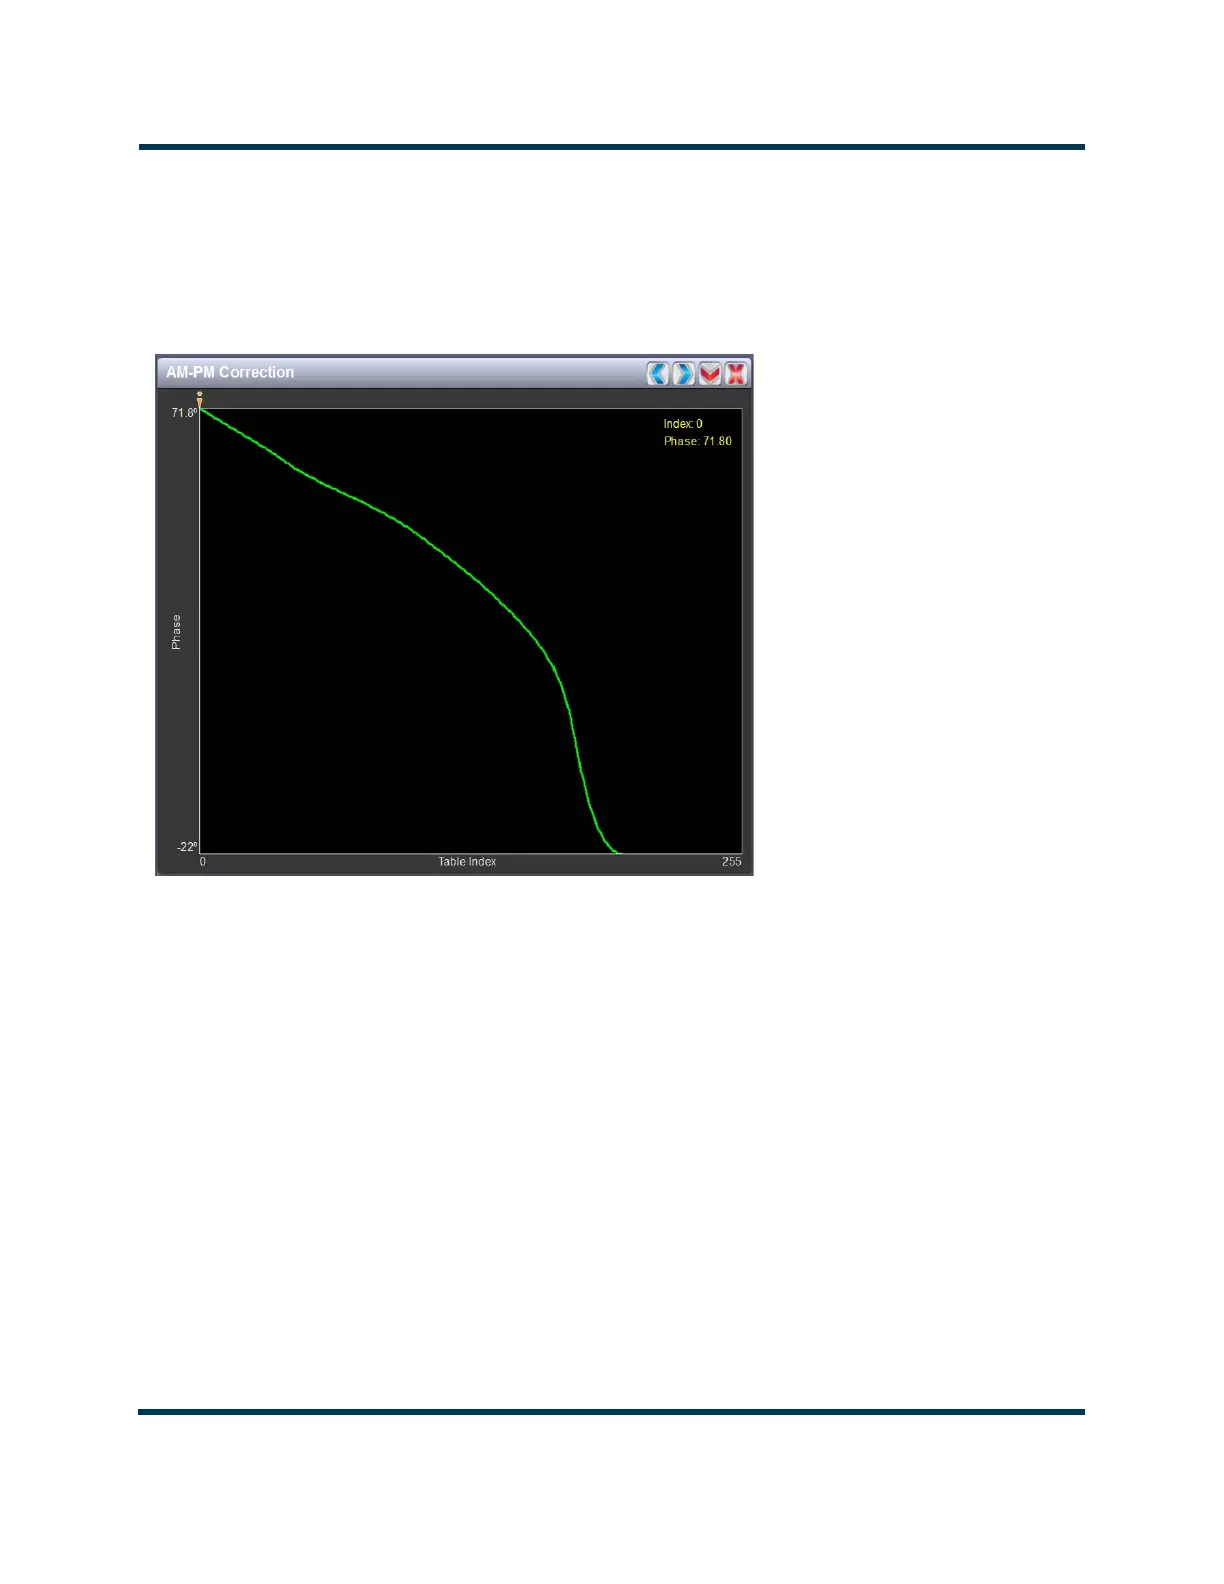
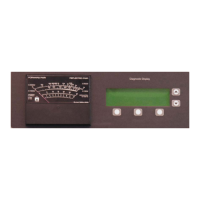
Figure 2.26: AM-PM Correction
AM-PM correction
This panel displays the phase correction being applied to the RF drive signal in order to
compensate for the transmitter’s (IPA +PA stage) phase non-linearity versus the output
power. For example, in Figure 2.26 the transmitter output power is low, so the curve in the
plot shows positive phase correction. Inversely, a negative phase correction will be displayed in
the plot given high output power levels. This correction is represented on the plot via the x-
axis (table index value of between 0-255). The y-axis represents the phase shift correction
applied for a given amplitude value.
Touch on the panel to display a cursor in the approximate area. The cursor position (phase and
LUT index) is noted in the upper, right-hand corner of the panel. Touch in other areas of this
instrument panel to provide a coarse adjustment of the cursor position.
Use the left and right buttons as fine adjustments.
Use the maximize or minimize buttons as required.