Version 3/01 Page 10/25
The table below describes the functions of the trend screen:
Key Function Description of function
F1 Setting trend Setting [mm / in]
F2 Power trend Power [kW / hp]
F3 Pressure trend Pressure [bar / psi].
F4 Capacity trend Capacity [mtph / stph] (tons per hour).
F5 Timescale 24 h <-- Changes the time scale shown on the screen.
F6 Timescale --> 6 min Changes the time scale shown on the screen.
F7 Close Exit to production data screen.
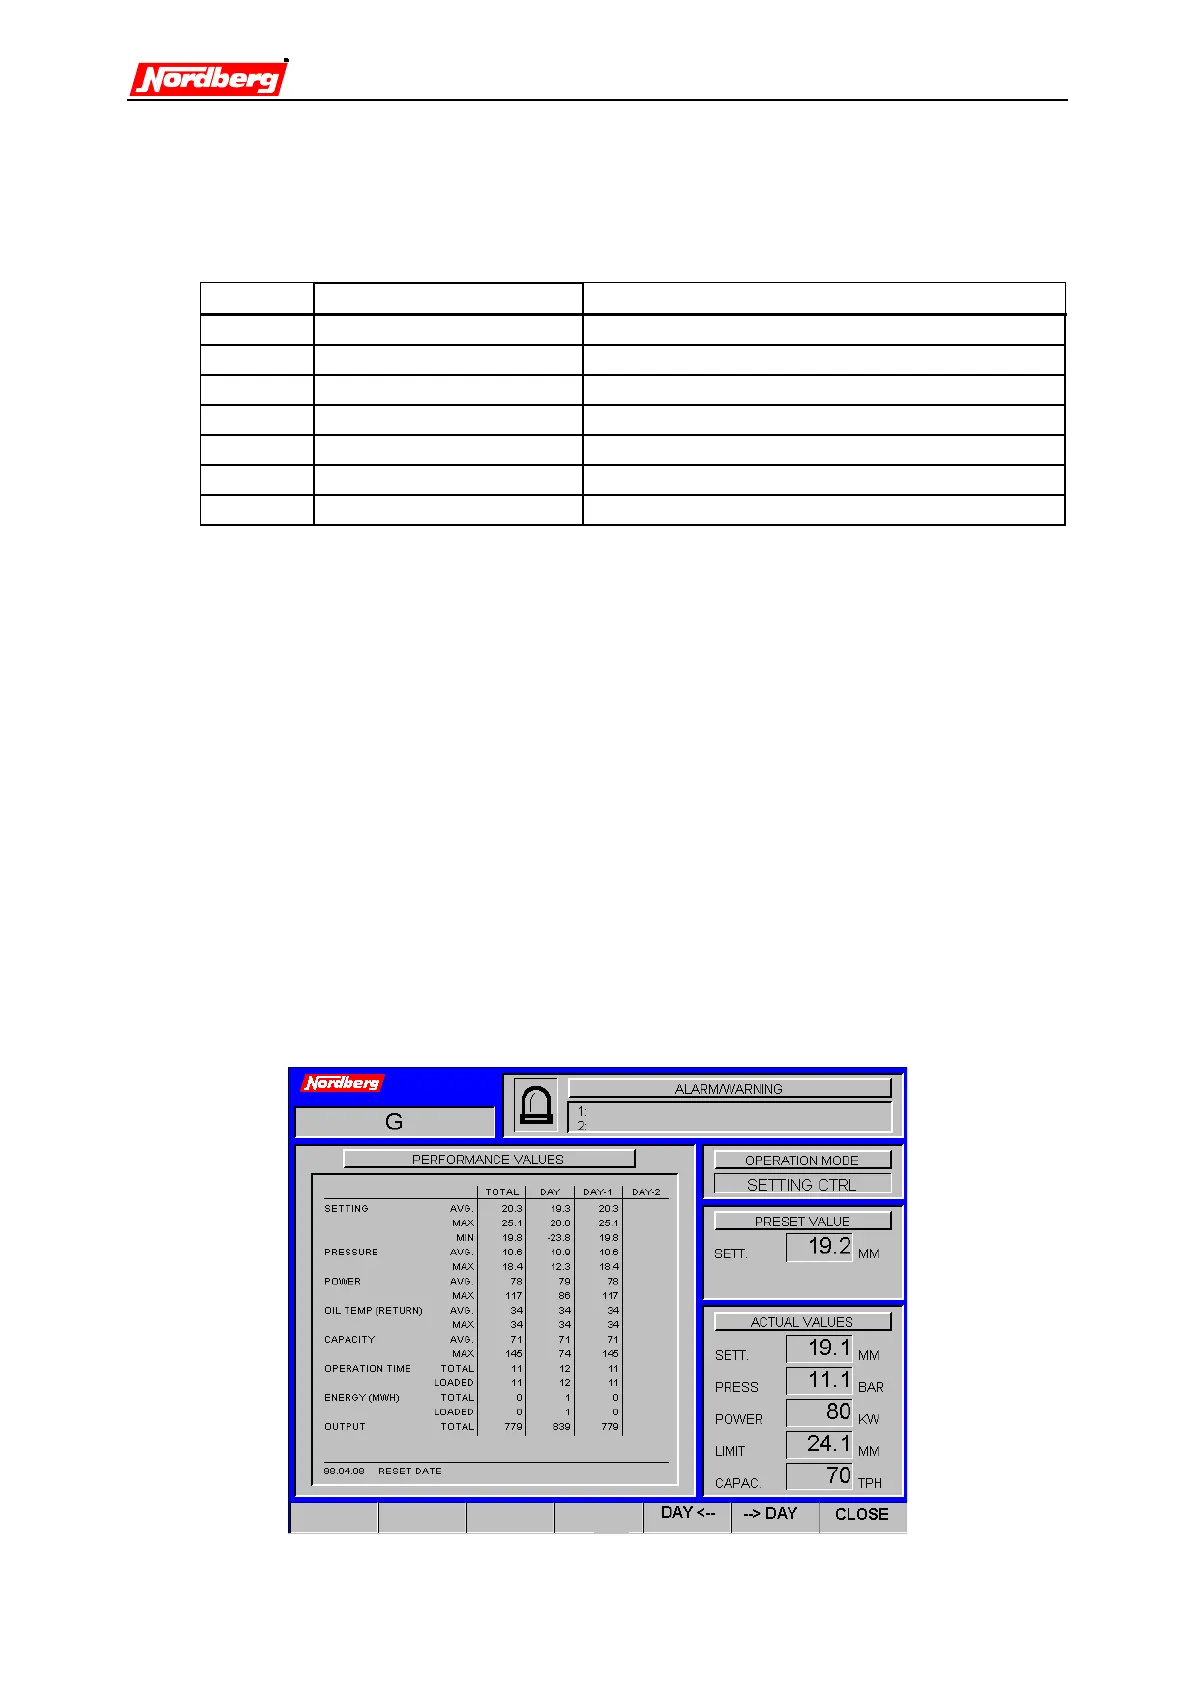
2.4.2 Field Data
The data is shown over the past ten days. Production data is registered of the available
measurements. The standard measurements are:
•
Setting; average, maximum, and minimum [mm / in]
•
Pressure; average and maximum [bar / psi]
•
Power; average and maximum [kW / hp]
•
Oil temperature; Return oil temperature; average and maximum [_C /_F]
•
Capacity; average and maximum with scales connected [tph] (if belt scale is
connected)
•
Running time; total and loaded [h]
•
Power consumption; total and loaded [MWh]
•
Output [tons] (if belt scale is connected)
Data log file is created automatically (at 0:00) every day.
 Loading...