48
PSI
10 2005
ATR
FEET
O
2
N
2
NOTE: The Pro Plus 2 will store oxygen accumula-
tion calculations for up to 10 dives conducted
during a 24 hour period. If the maximum limit for
oxygen loading has been exceeded for that day (24
hour period), all of the segments of the O2 bar
graph will be displayed flashing .
Depth/Time values will not appear until the O2 bar
graph recedes into the green (normal) zone (i.e.,
your daily oxygen dosage decreases an amount
equivalent to the amount accumulated during the
latest dive completed).
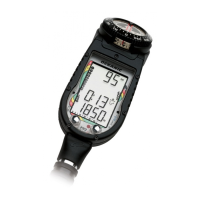
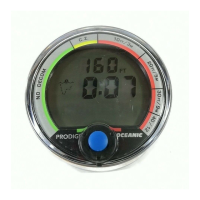
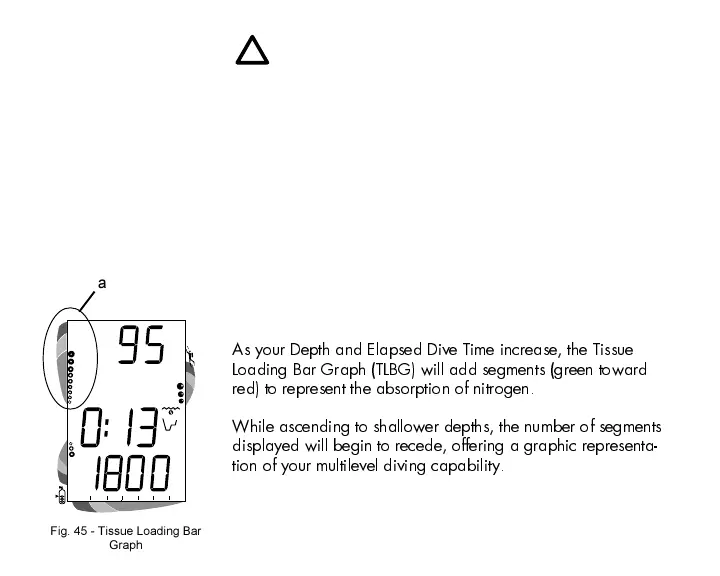
TISSUE LOADING BAR GRAPH (Fig. 45a)
As your Depth and Elapsed Dive Time increase, the Tissue
Loading Bar Graph (TLBG) will add segments (green toward
red) to represent the absorption of nitrogen.
While ascending to shallower depths, the number of segments
displayed will begin to recede, offering a graphic representa-
tion of your multilevel diving capability.
Fig. 45 - Tissue Loading Bar
Graph
a