6.Bluetooth Function – B35(T) only
Upgrade Online: Click , and click "About", the following interface is shown. Click
"Upgrade" as below.
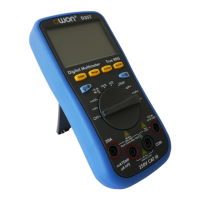
Data Graph and Table: Click to view data graph and table. Click to
show setting menu.
Trending
graph
Zoom Controls
Data table
Show menu
Data Graph&Table
Data Graph&Table
Open local file
Read the saved file (.CSV)
Save data Save the displayed data into .CSV file
Share Share the measurements via the installed sharing apps
Clear data Clear the data displayed
Setting
Sampling Interval: Set the interval of sampling (unit second).
Enable Period: Log data within the defined period.
Record Period: Define the period time if the period is enabled.
Fill: Check to fill the area as blue below the data line.
Exit Exit the APP
Note: In trending graph, you can pinch the screen to zoom. The Y axis (value) can be
zoomed by gesturing along the up-down direction, and the X axis (time) can be
zoomed by gesturing along the left-right direction.