3. ELECTRICAL INSTALLATION 31
Plots of I
2
t Against Drive Current
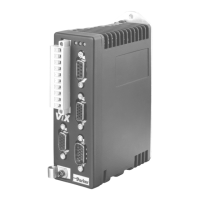
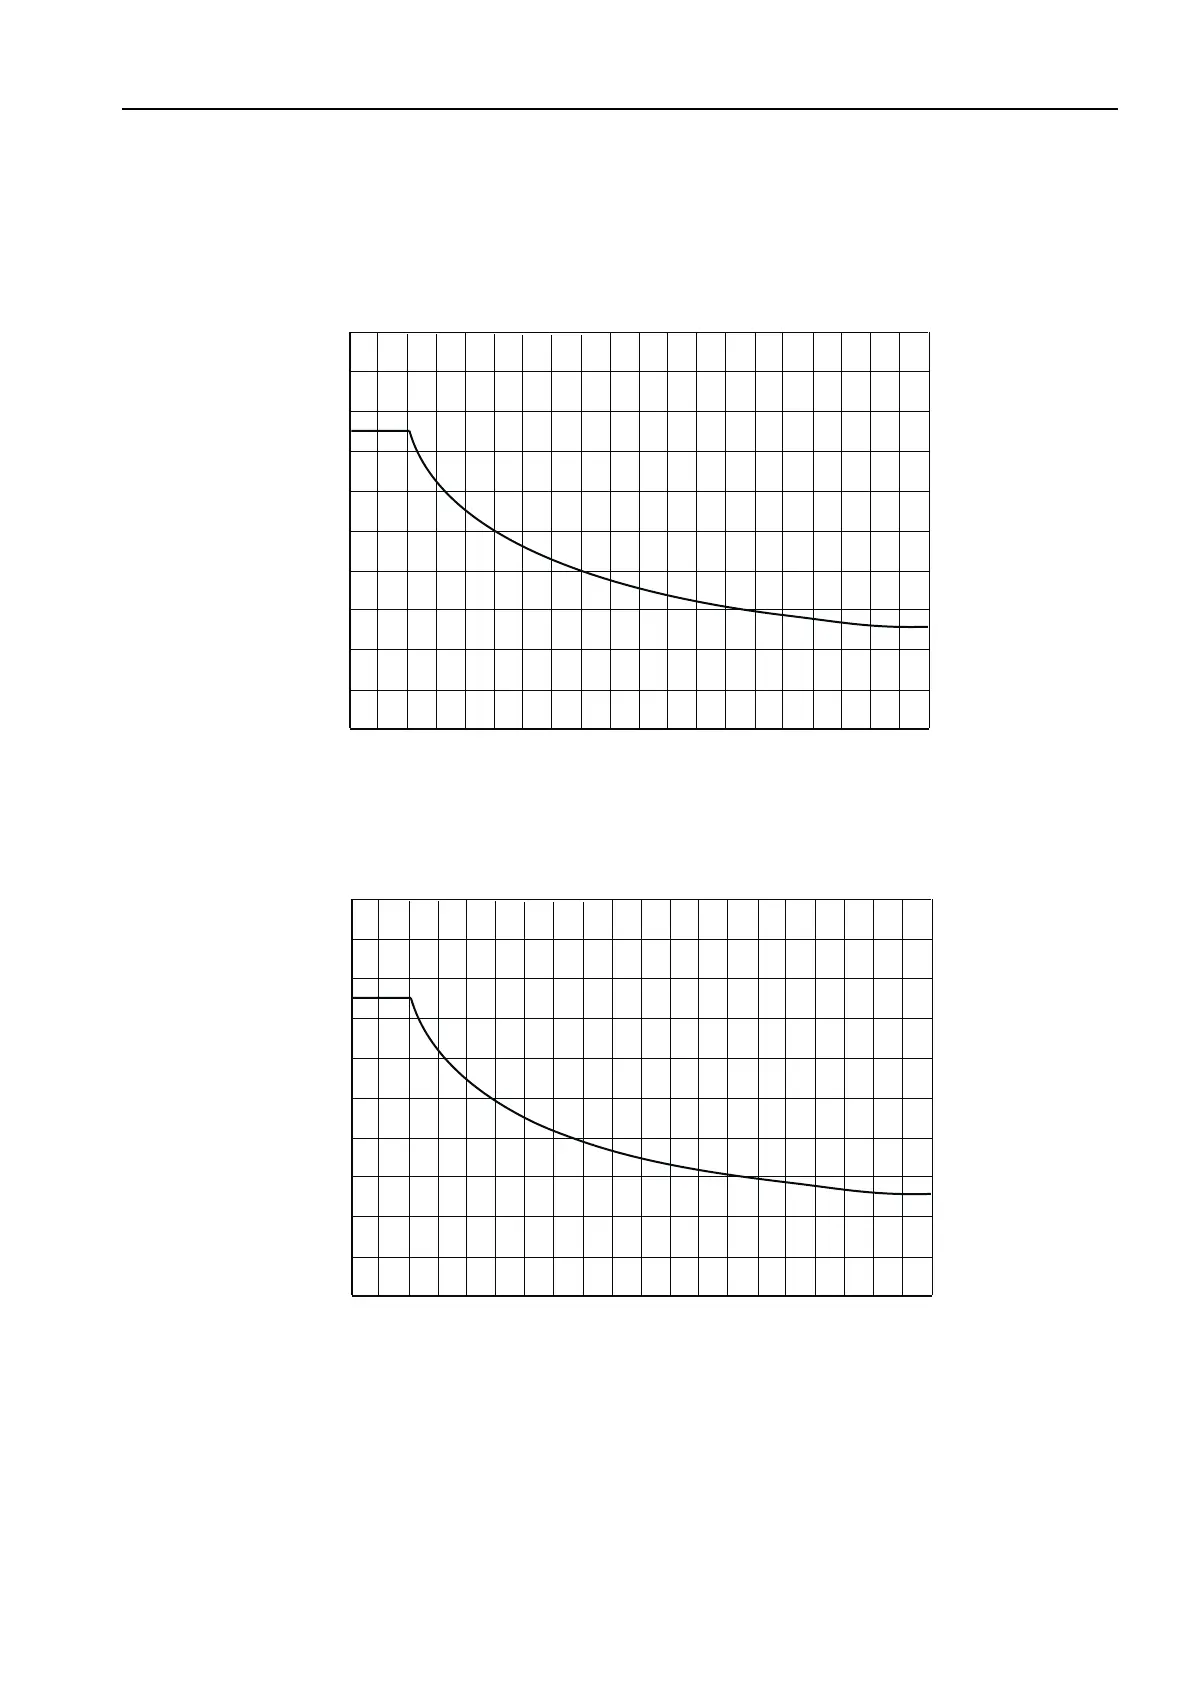
The following graphs plot drive current against I
2
t time in seconds for a moving and
stationary motor for both power versions of the drive.
0
1
1
2
2
3
3
4
4
5
5
6
6
7
7
8
8
9
9
10
10 11 12
13
14 15
16
17
18
19
20
0
Time to trip I
2
t circuit in seconds
ViX250 I
2
t function - moving
ViX250 demanded phase current in A rms
Figure 3-13.ViX250 I
2
t function - moving
0
1
.2
2
.4
3
.6
4
.8
5
1
6
1.2
7
1.4
8
1.6
9
1.8
10
2 2.2 2.4
2.6
2.8
3
3.2
3.4
3.6
3.8
4
0
Time to trip I
2
t circuit in seconds
ViX250 I
2
t function - stationary
ViX250 demanded phase current in A rms
Figure 3-14.ViX250 I
2
t function - stationary
 Loading...