Presentation Modes
n
VALUE
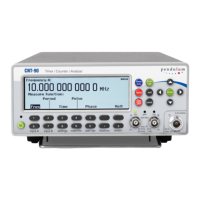
The Value Mode gives the result of the main
measurement function as a numerical value in
large characters with full resolution. In addi
-
tion, the results of supplementary measure
-
ments are displayed in smaller characters with
limited resolution near the bottom of the
screen.
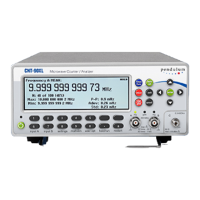
In case the Limits Alarm function is enabled,
Range is the selected Limit Mode,andAlarm
is the selected Limit Behavior,thenasimple
graph is also given in which the result of the
current measurement is shown as an
'emoticon' at a position relative to the limits
set by the operator. Values are represented by
a smiling face when inside the limits and a
frowning face when outside.
If one of the limits has been exceeded, the
limit indicator at the top of the display will be
flashing. Only data inside the limits is used for
autoscaling, so results outside the visible
graph area are replaced by an arrowhead at the
left or the right edge of the display.
n
STAT/PLOT
If you want to analyze a number of successive
measurements using statistical methods, this is
the key to operate. There are three display
modes available by toggling this key:
•
Numerical Mode
•
Histogram Mode
•
Trend Plot Mode
Numerical Mode
In this mode the statistical information is dis
-
played as numerical data containing the fol
-
lowing elements:
•
Mean: running mean value of the main
measurement over N samples
•
Max: maximum value
•
Min: minimum value
•
P-P: peak-to-peak deviation
• Adev: Allan deviation
•
Std: standard deviation
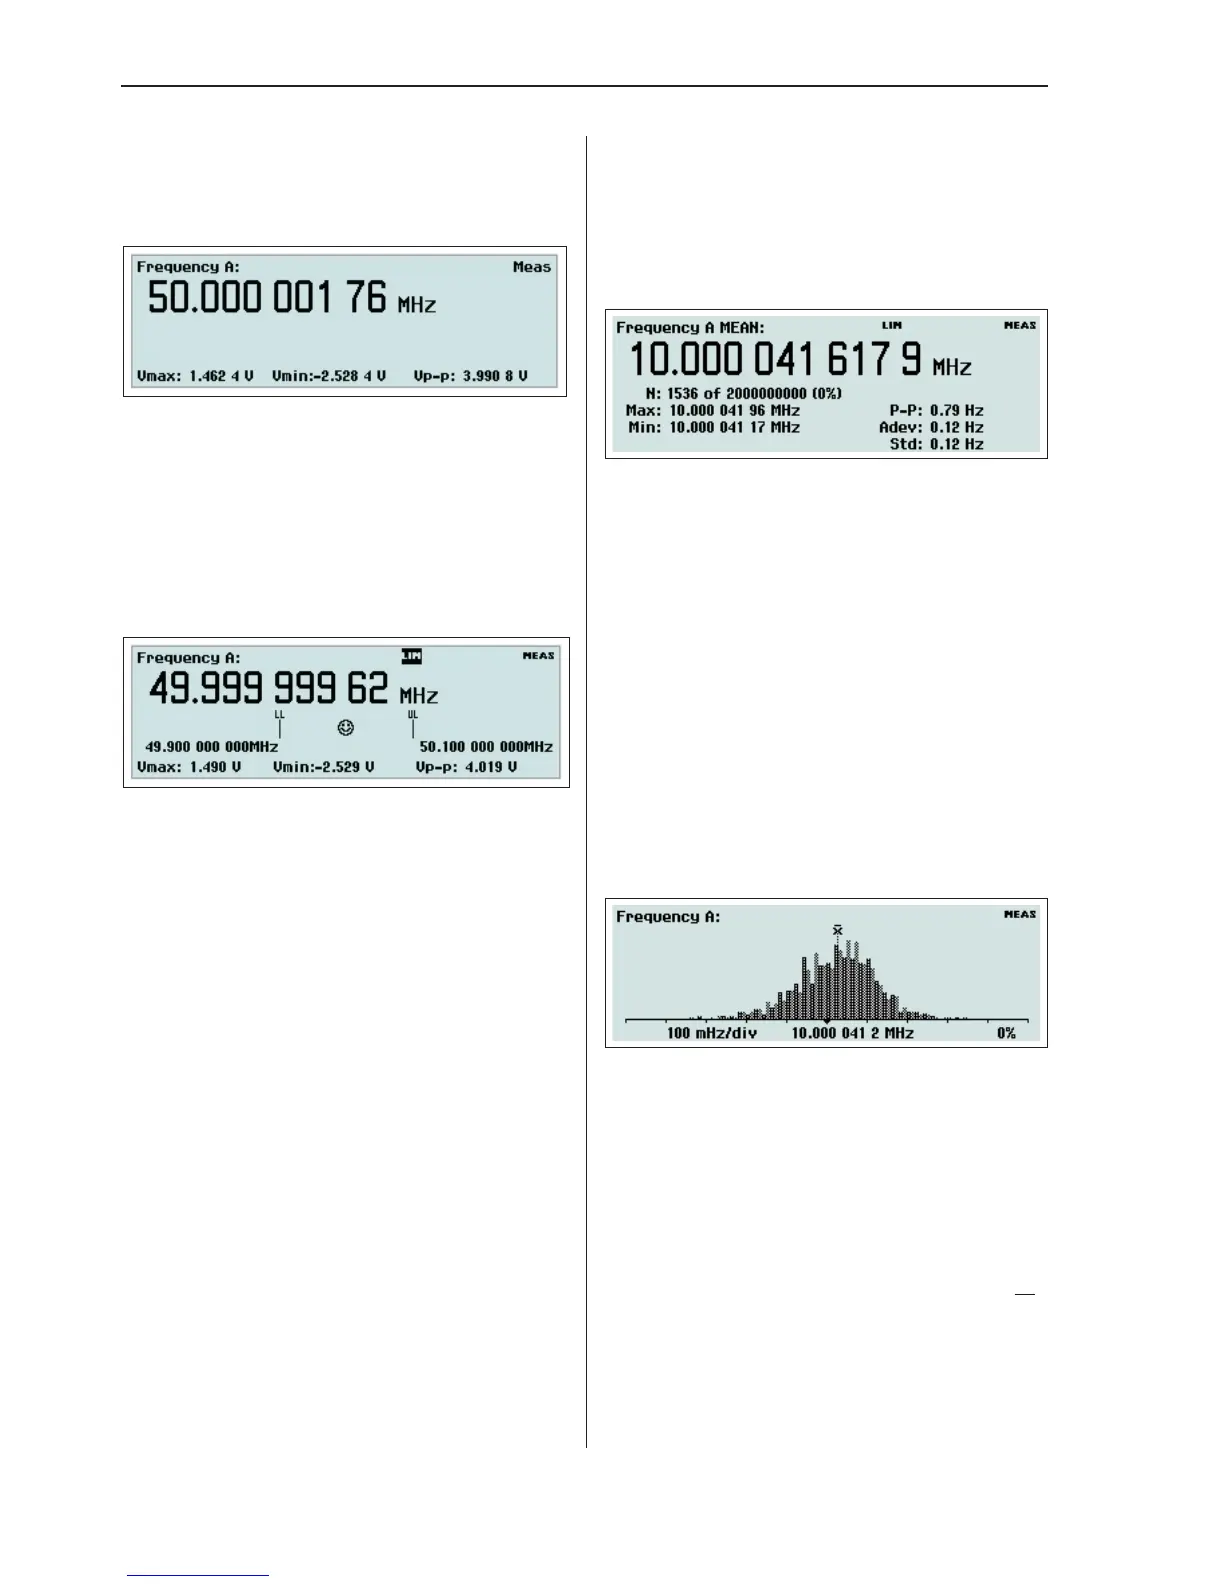
Histogram Mode
Successive measurement results are converted
into a histogram.
The number of bins along the horizontal axis
can be set by the user through the Settings
® Stat menu. The bins in the histogram are
autoscaled based on the measured data. Lim
-
its, if enabled, and the running mean value
X
are shown as vertical dotted lines. The center
of the graph is indicated by a filled triangle on
the X-axis. The corresponding numerical
value is displayed below it and so is the scale
Operating the Counter
3-4 Description of Keys
 Loading...