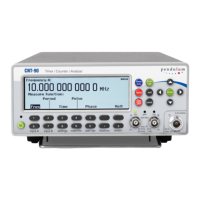
Fig. 2-4 Main and aux. parameters.
Value mode gives single line numerical presentation of individual results, where the main parameter is displayed in large
characters with full resolution together with a number of auxiliary parameters in small characters with limited resolution.
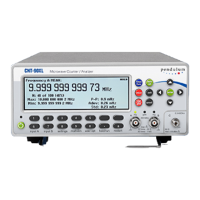
Fig. 2-5 Limits presentation.
If Limit Behavior is set to Alarm and Limit Mode is set to Range you can visualize the deviation of your measurements in
relation to the set limits. The numerical readout is now combined with a traditional analog pointer-type instrument, where
the current value is represented by a “smiley”. The limits are presented as numerical values below the main parameter,
and their positions are marked with vertical bars labelled LL (lower limit) and UL (upper limit) on the autoscaled graph.
If one of the limits has been exceeded, the limit indicator at the top of the display will be flashing. In case the current
measurement is out of the visible graph area, it is indicated by means of a left or a right arrowhead.
STAT/PLOT
If you want to treat a number of measurements with statistical methods, this is the key to operate. There are three
display modes available by toggling the key:
Numerical
Histogram
Trend Plot
Numerical
21 / 50
 Loading...