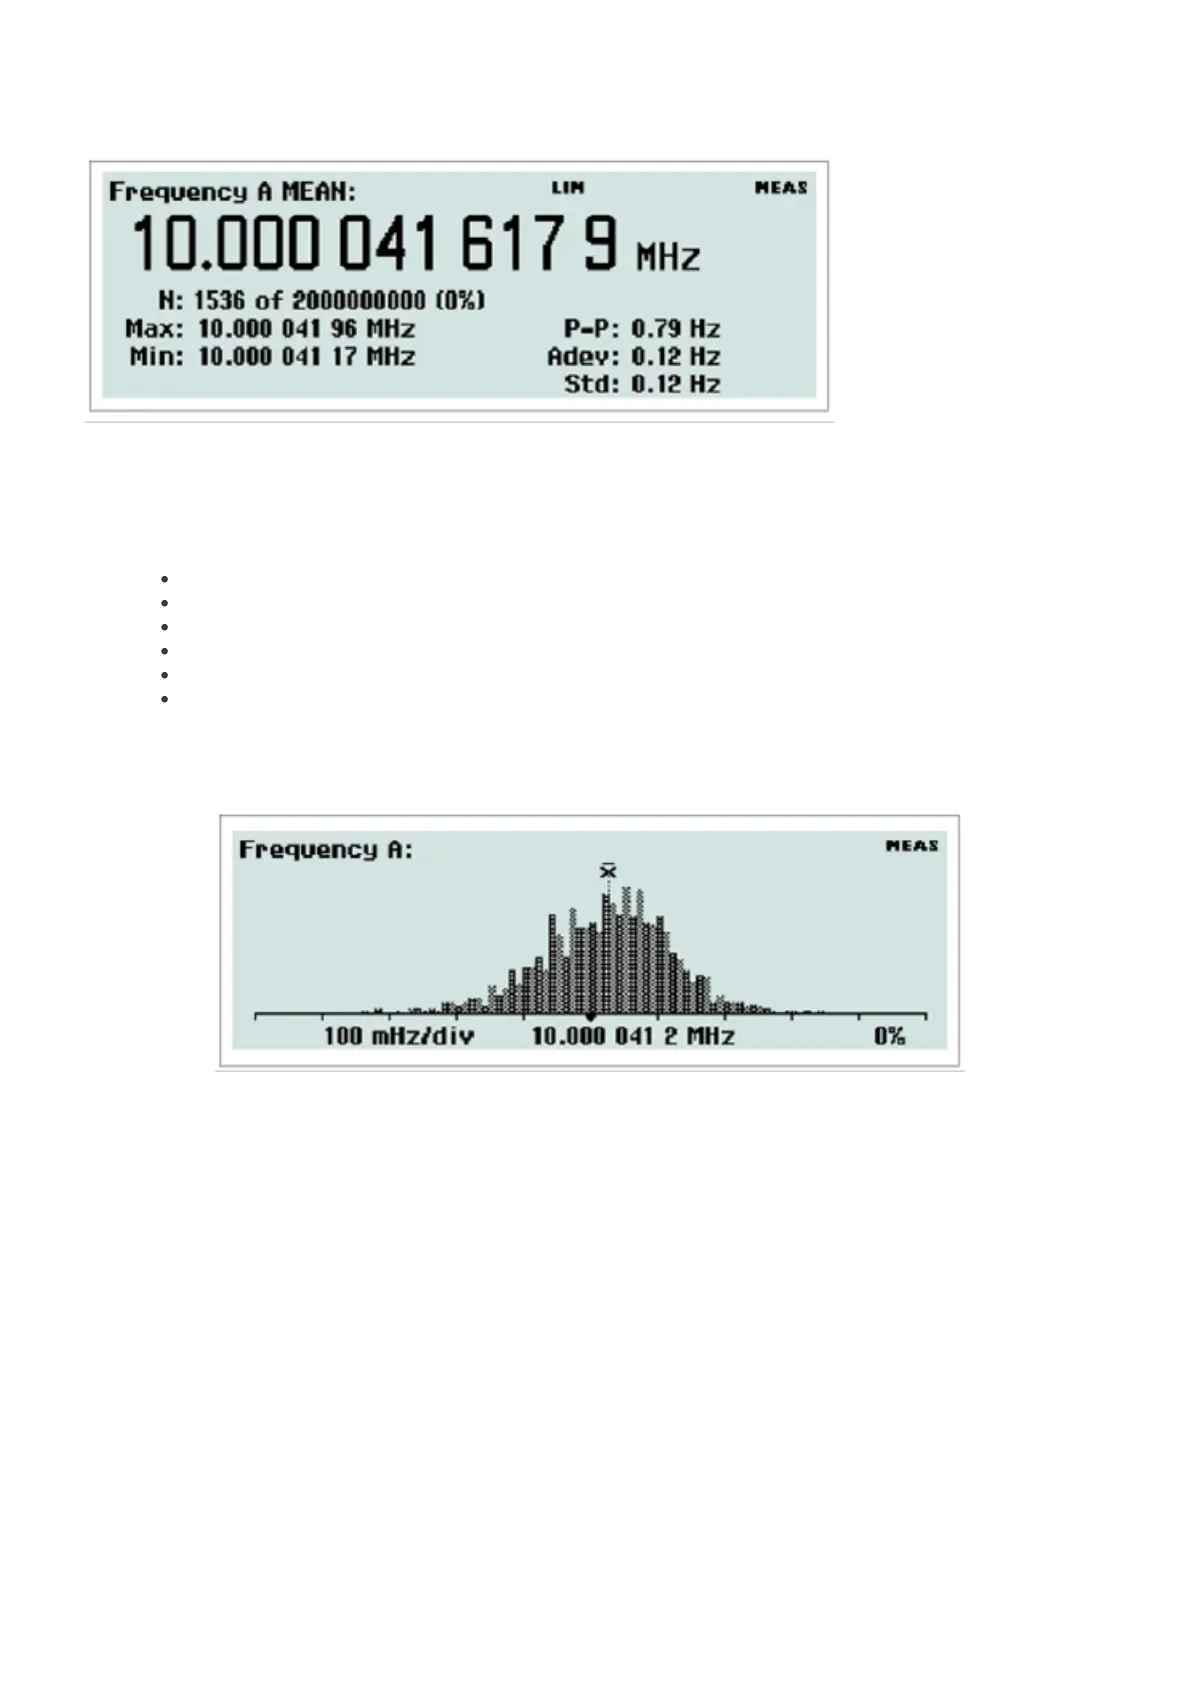
Fig. 2-6 Statistics presented numerically.
In this mode the statistical information is displayed as numerical data containing the following elements:
Mean: mean value
Max: maximum value
Min: minimum value
P-P: peak-to-peak deviation
Adev: Allan deviation
Std: Standard deviation
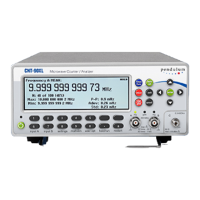
Histogram
Fig. 2-7 Statistics presented as a histogram.
The bins in the histogram are always autoscaled based on the measured data. Limits, if enabled, and center of graph
are shown as vertical dotted lines. Data outside the limits are not used for autoscaling but are replaced by an arrow
indicating the direction where non-displayed values have been recorded.
Trend Plot
22 / 50