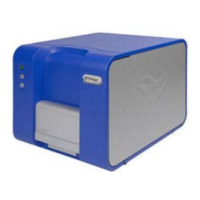
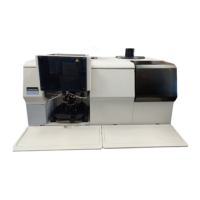
Do you have a question about the PerkinElmer LabChip GX Touch and is the answer not in the manual?
Contains safety warnings for instrument use.
Ensures personnel are trained in general and specific safety practices.
Guidelines for handling chemicals safely with the instrument.
Safety precautions related to the instrument's laser system.
Precautions for safe use of electrical components.
Safety measures concerning moving parts and pinch hazards.
Information on the intended use of the LabChip GX Touch instruments.
Guides for specific assays, including preparation and troubleshooting.
Explanation of how the LabChip GX Touch assay technology works.
Instructions for launching the instrument control software.
Procedure to clear debris from pressure lines for optimal performance.
Step-by-step guide for correctly inserting the microfluidic chip.
Procedure for calibrating the instrument for specific assays.
Process to prepare the chip for assay analysis.
Instructions for loading necessary consumables into the instrument.
Configuring settings such as assay type, plate, and wells for a run.
Observing the progress and status of an ongoing assay run.
Adjusting analysis parameters while an assay is in progress.
Procedure to manually halt an assay run before it finishes.
Procedure for safely unloading the chip after a run.
Illustrations and formats for exporting different data types.
Configuring automatic export of data tables, graphs, or gels.
Steps to export data files once the assay run has finished.
Choosing specific wells for data visualization and analysis.
Displaying electropherogram and gel data for selected wells.
Visualizing assay results as graphs in the EGram tab.
Adjusting the magnification of graph and gel views.
Overview of the main navigation buttons and their functions.
The primary interface for initiating operations like priming, running, and washing.
Interface for defining assay run parameters via multiple tabs.
Provides real-time status of the instrument, chip, and run operations.
Access point for diagnostics, export settings, optics calibration, and more.
Adjusting parameters for peak detection and analysis during runs.
Daily and monthly procedures for cleaning critical interface components.
Procedure to calibrate instrument optics for consistent fluorescence readings.
Daily cleaning of electrodes to ensure proper conductivity.
Procedure for safely replacing instrument fuses.
Verifies proper software installation and integrity.
Performing tests to verify instrument operation and components.
List of common error messages and their potential causes/solutions.
Troubleshooting steps for communication loss with connected devices.
Diagnosing and resolving issues related to the instrument's focus mechanism.
Identifying causes and solutions for assay calibration failures.
Addressing common issues like inability to save files or software lock-ups.
| Application | DNA, RNA, and protein analysis |
|---|---|
| Detection Method | Laser-induced fluorescence |
| Throughput | Up to 96 samples per run |
| Weight | Approximately 25 kg |
| Power Requirements | 100-240 V AC, 50/60 Hz |
| Operating Temperature | 15-30°C |
| Connectivity | USB, Ethernet |
| Design | Benchtop |
| Type | Automated electrophoresis system |
| Technology | Microfluidics |
| Sample Types | DNA, RNA |
| Sample Volume | 2 µL |
| Analysis Time | 30 seconds to 2 minutes per sample |
| Sensitivity | 0.1 ng/µL for DNA |
| Operating Humidity | 20% to 80% RH, non-condensing |
