18
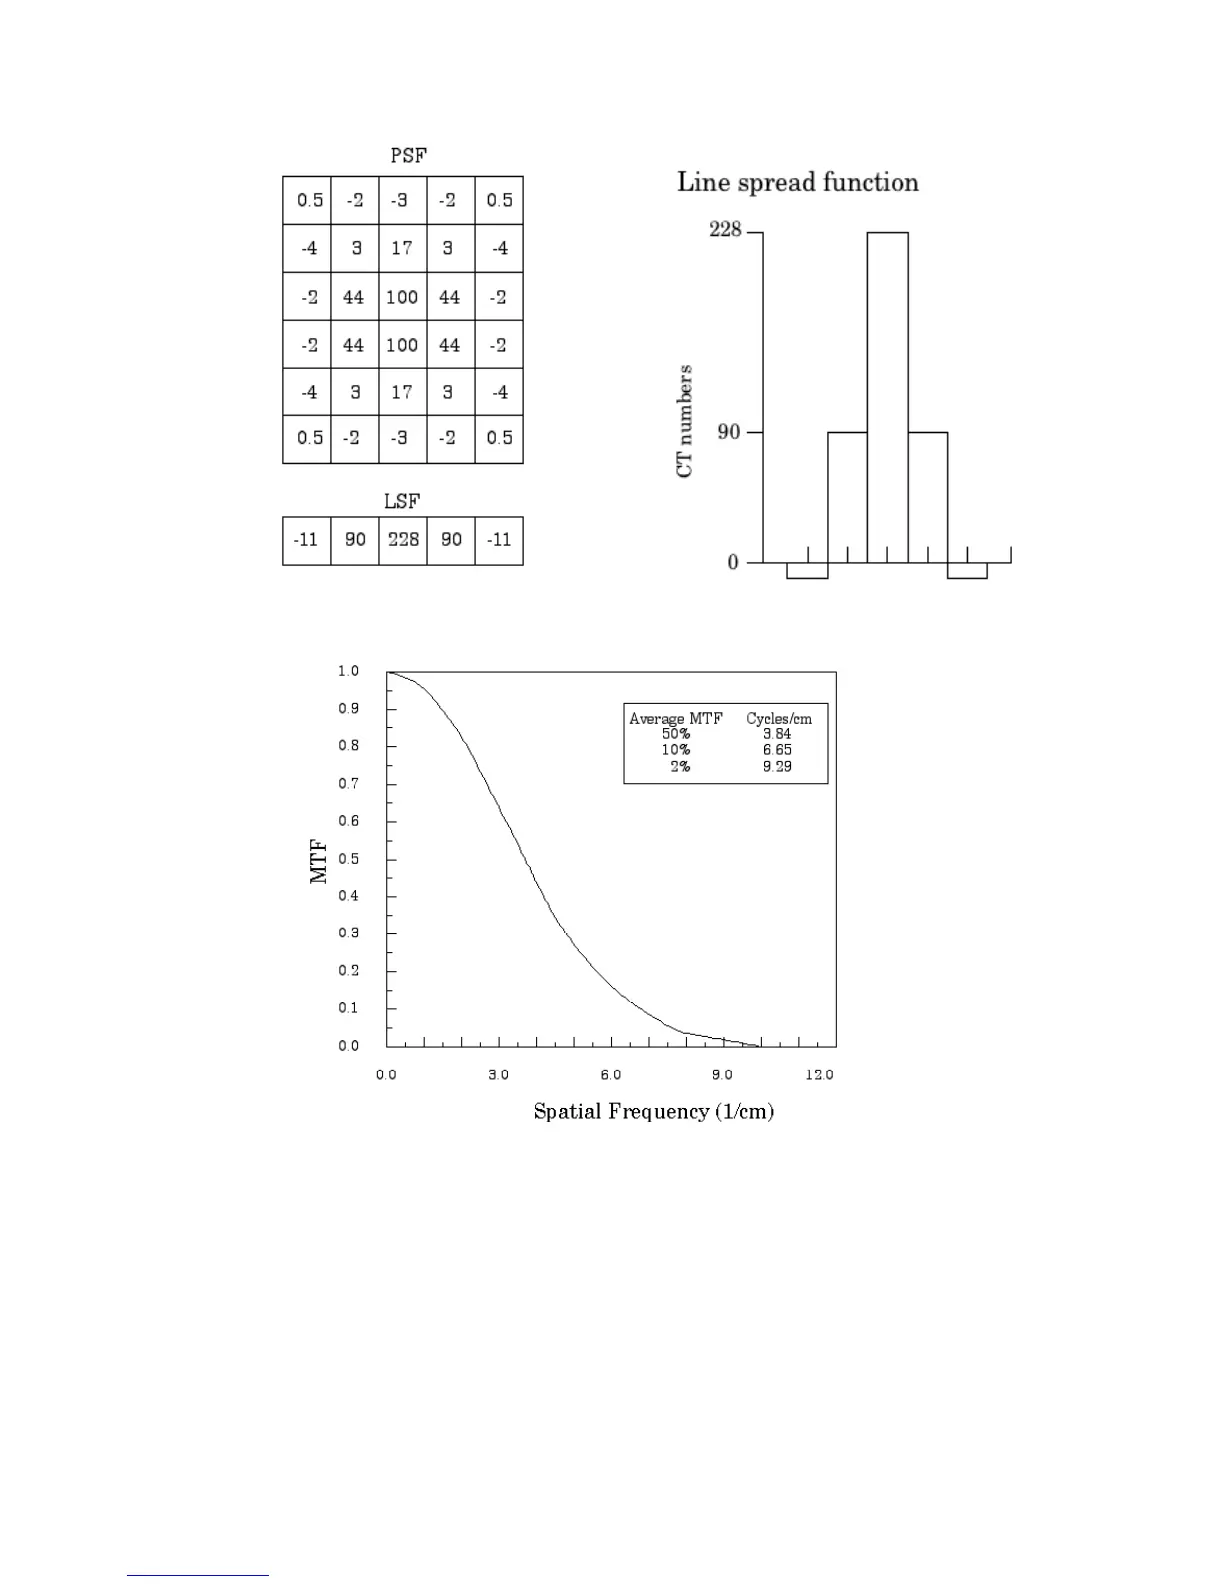
The above illustration shows how by summing the columns (y axis) of numbers in the
point spread function (PSF) the line spread function (LSF) for the x axis is obtained.
The MTF curve results from the Fourier transform of the LSF data. Generally it
is easiest to use automated software for this operation. Some CT scanners are
supplied with software which can calculate the MTF from the Catphan® bead images.
Independent software is listed in the Current automated programs available section
of the manual.
Use of automated scanner MTF programs
Many manufacturers include automated MTF software in the standard scanner software
packages. Because the bead is cast into an epoxy background which has a different
density than water, the software must accept an input for the background. The point size
of .28mm must also be selected. While a sphere does produce a different density prole
than a cross section of a wire or cylinder, the actual difference is not usually signicant in
current CT scanners.