Viewing Run Data page 251
User Guide for Maurice, Maurice C. and Maurice S.
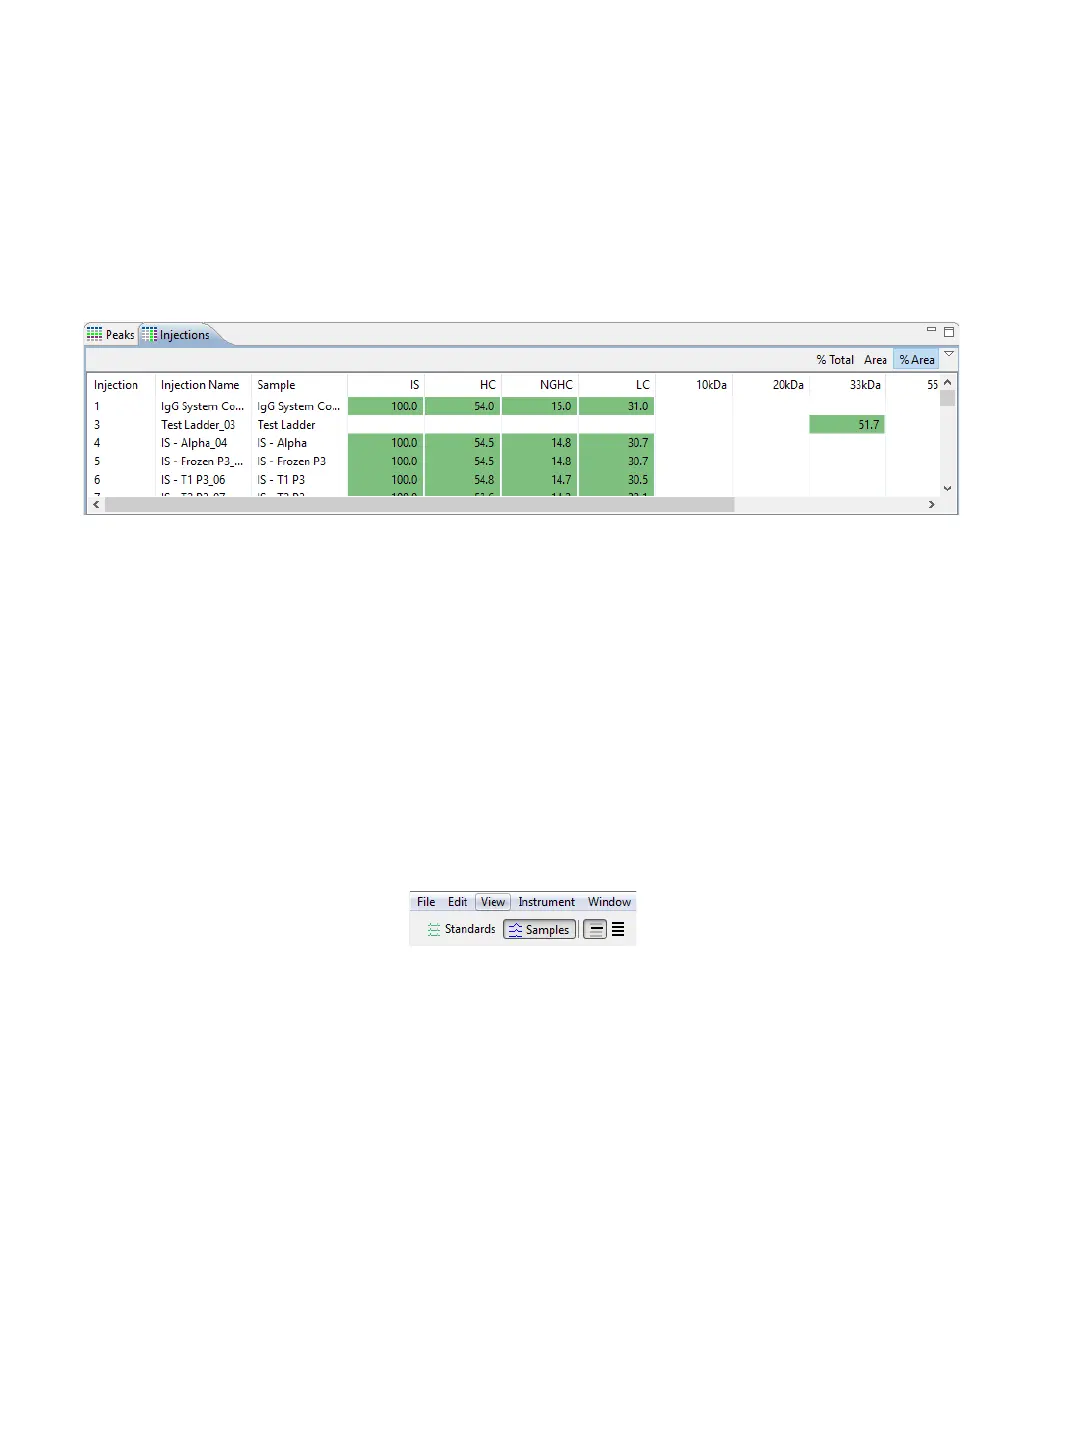
• To view % area in the peak name columns - This displays the peak area ratio compared to the
sum of all named peak areas. This value results from dividing the individual peak area by the sum
of all peak areas for the injection and multiplying by 100.
Viewing Run Data
The Analysis screen lets you view data for just one injection, specific injections or all injections in the run.
Each run file has data for the sample proteins and the Internal Standard detected in each injection.
Switching Between Samples and Standards Data Views
Here’s how you switch between viewing data for your samples and standards:
• To view sample data - Click Samples in the View bar or select View in the main menu and click
Samples.
• Data in this view is for sample proteins only.
• The graph displays electropherograms with a y-axis of Absorbance units (mAU) and an x-axis of
RMT (relative migration time).