page 356 Chapter 12: cIEF Data Analysis
User Guide for Maurice, Maurice C. and Maurice S.
Checking Your Results
If you see a data warning in the Experiment pane, these steps will also help you identify and correct any
issues. Compass for iCE detects your sample protein and pI marker peaks and reports results automatically.
But, we always recommend you review your data using the steps in this section as a good general practice
to make sure your results are accurate. Please see the step by step procedure in
“Checking Your Data” on
page 138 to do this.If you see a data warning in the Experiment pane, these steps will also help you identify
and correct any issues.
Group Statistics
You can use the Grouping view to have Compass for iCE do a statistical analysis of named proteins in your
injections (see
“Manual Peak Integration” on page 406 for more info on setting named peaks up). Statistics
for each protein are also plotted for easy comparison.
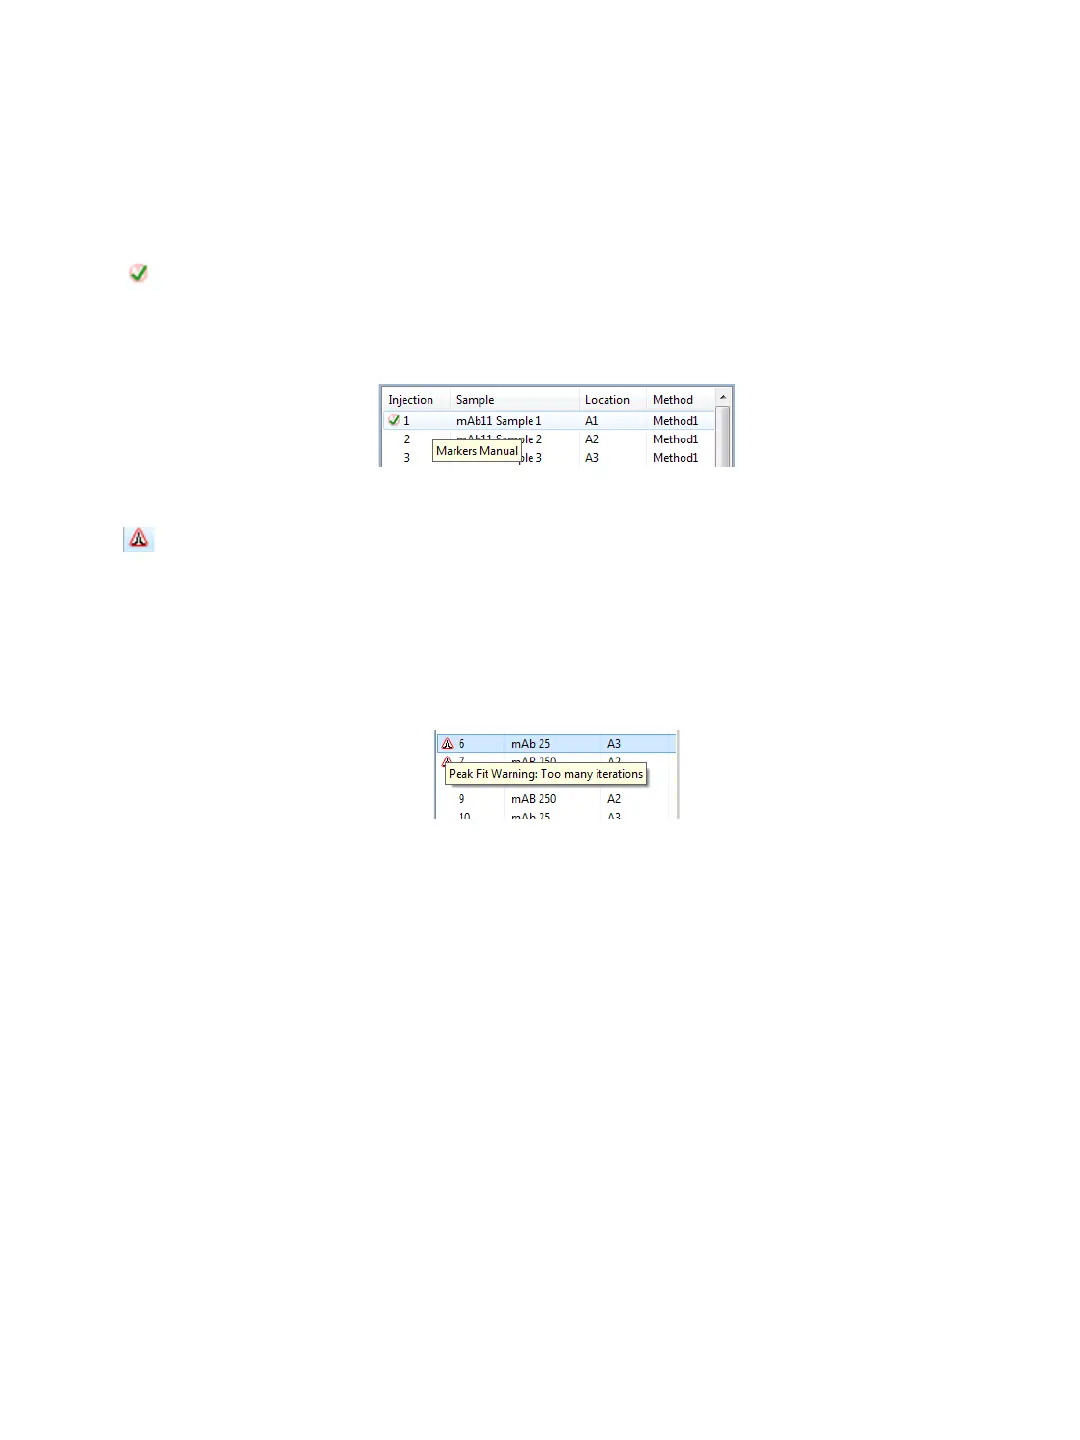
Manual correction of markers data notification - This means a user changed the pI marker
data manually. Roll your mouse over the icon to display the type of modification that was
made.
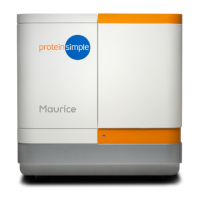
Peak fit warning - Means that a peak can’t be fit properly. This can sometimes be caused
when a broad peak is fitted as multiple narrow peaks. Changing the peak width can help in this
case. The warning is also caused by very small peaks around main peaks, or small peaks that are
close to the end of the separation range. You can often fix this by removing the peak(s) using
the steps in
“Step 3: Checking Sample Peaks” on page 141. Roll your mouse over the icon to
display warning details.