Basic Measurement Examples
R&S
®
ESR
90Getting Started 1316.3749.02 ─ 09
b) Press the "Res BW Manual" softkey and enter 30 kHz.
c) Press the "Video BW Manual" softkey and enter 1 kHz.
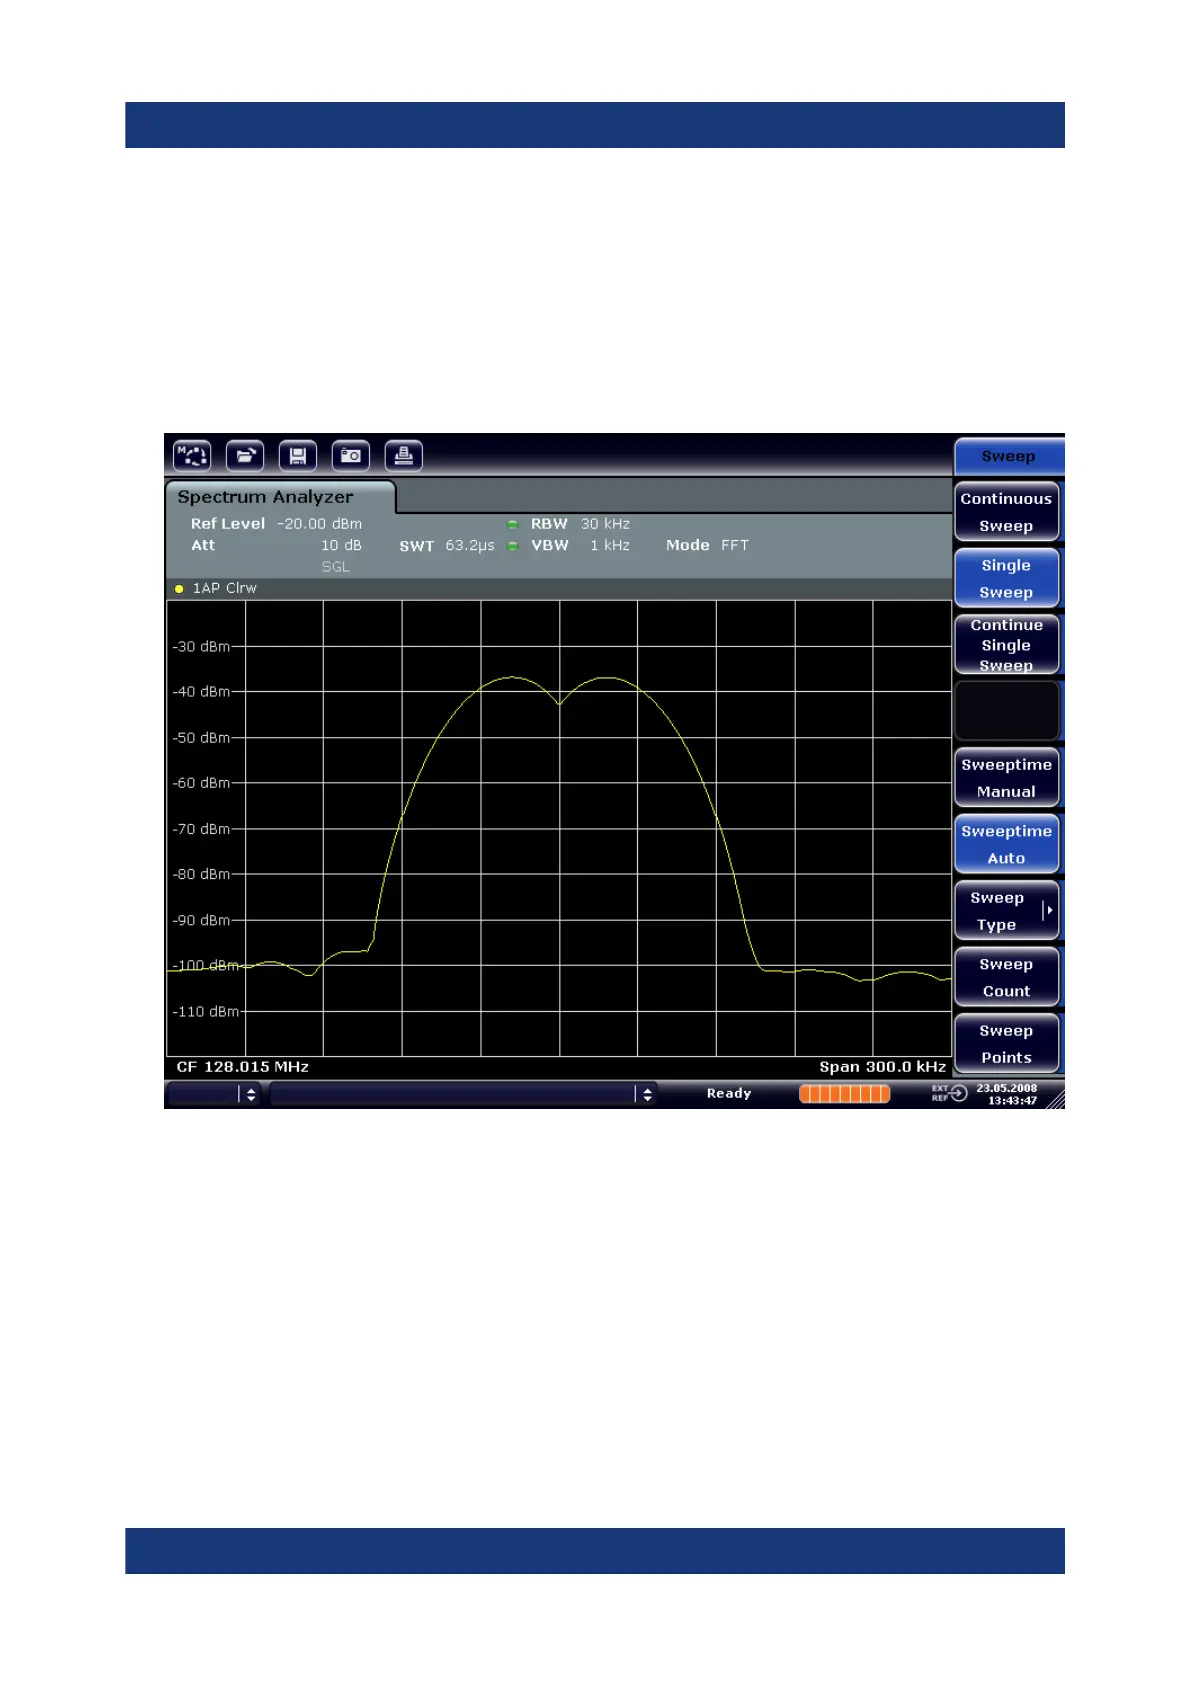
Note: Larger video bandwidths. The video bandwidth is set to 1 kHz in order
to make the level drop in the center of the two signals clearly visible. At larger
video bandwidths, the video voltage that results from envelope detection is not
sufficiently suppressed. This produces additional voltages, which are visible in
the trace, in the transition area between the two signals.
Figure 7-4: Measurement of two equally-leveled RF sinusoidal signals with the resolu-
tion bandwidth which corresponds to the frequency spacing of the signals
Matching generator and R&S ESR frequencies
The level drop is located exactly in the center of the screen only if the genera-
tor frequencies match the frequency display of the R&S ESR exactly. To ach-
ieve exact matching, the frequencies of the generators and the R&S ESR
must be synchronized.
5. Set the resolution bandwidth to 100 kHz. To do so, in the bandwidth menu,
press the "Res BW Manual" softkey and enter 100 kHz.
It is no longer possible to clearly distinguish the two generator signals.
Measuring Signal Spectra with Multiple Signals

 Loading...

