CHAPTER 5
22 RCM-Sprayer Ratio Rate (without Boom Control) Calibration and Operation Manual
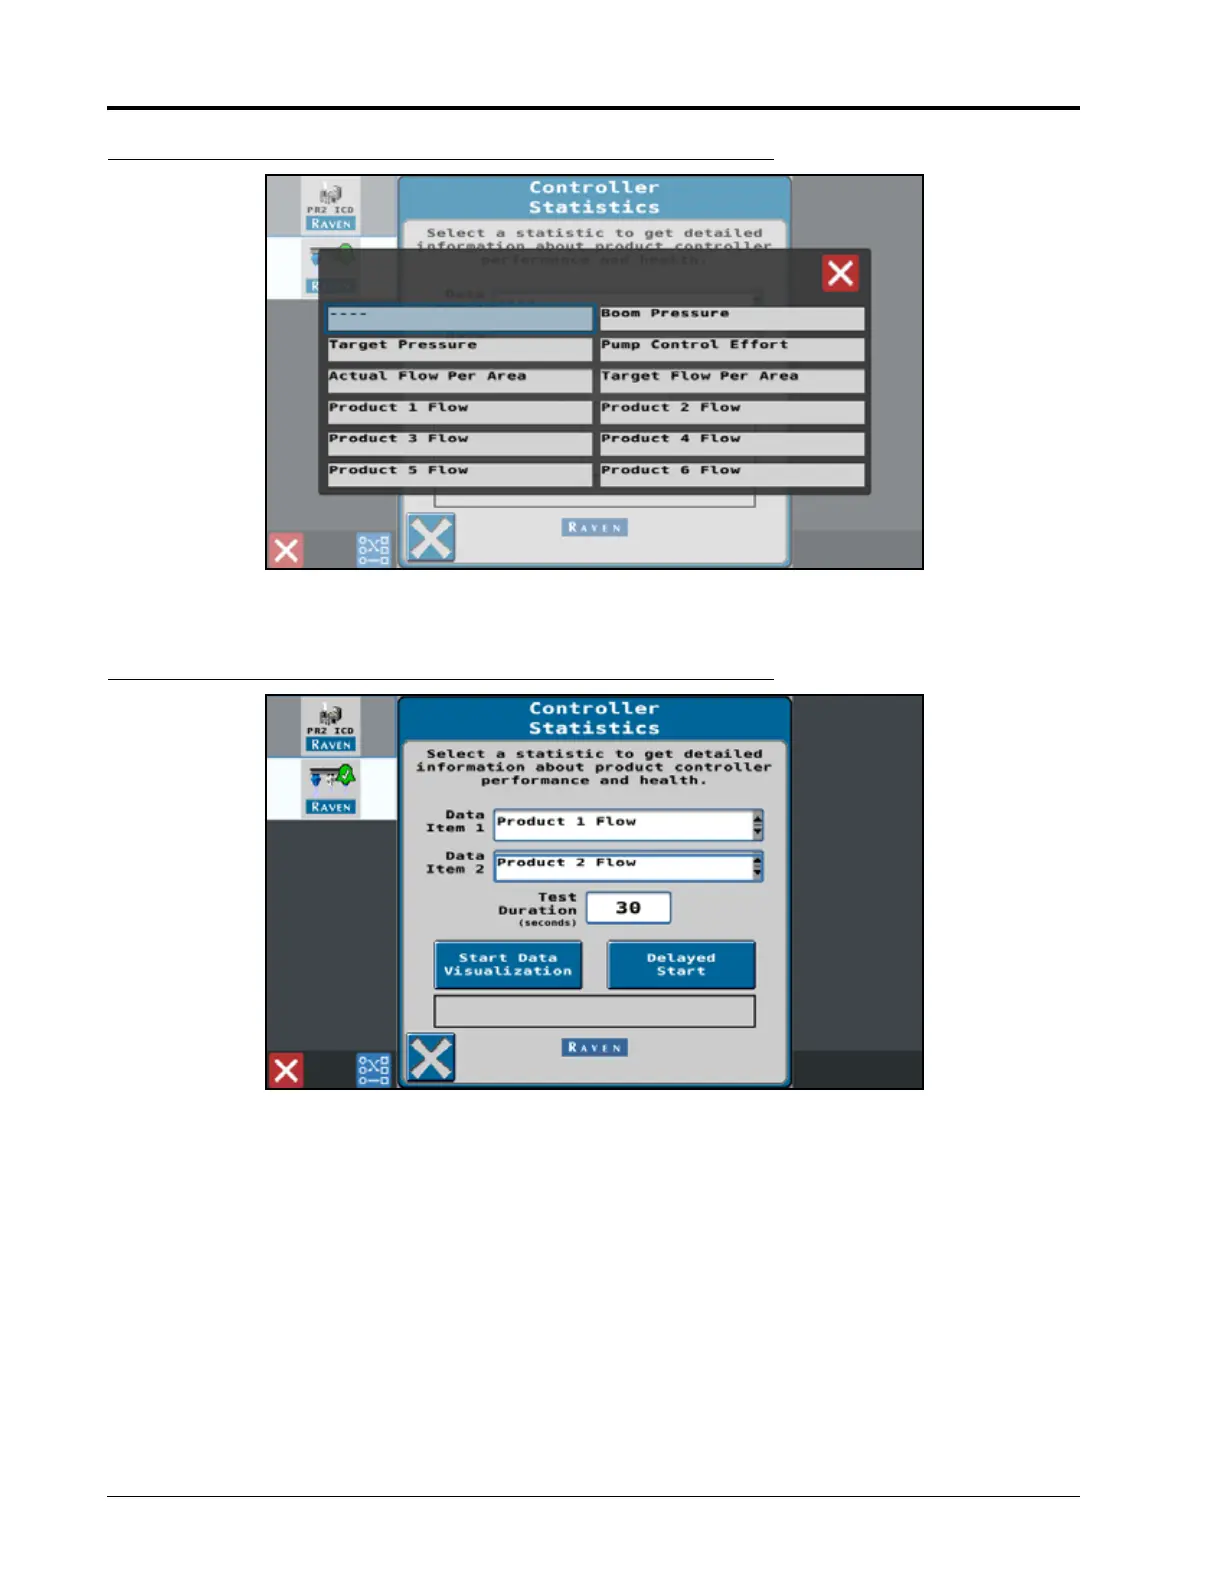
FIGURE 6. Data Visualization Options
7. When the desired data items are set, select the Start Data Visualization button to begin viewing flow charts.
FIGURE 7. Controller Statistics Data Visualization Setup
NOTE: Figure 8 on page 23 shows an example of a data visualization. The display shows data from 1 hour
spraying. The latest data is shown at the right side of the graph. Data moving to the left is older up to
the 1 hour mark.
A key is displayed at the bottom of the chart for the data shown on the page.
 Loading...