Diagnostics and Troubleshooting: Visualize Spray Data 23
DIAGNOSTICS AND TROUBLESHOOTING
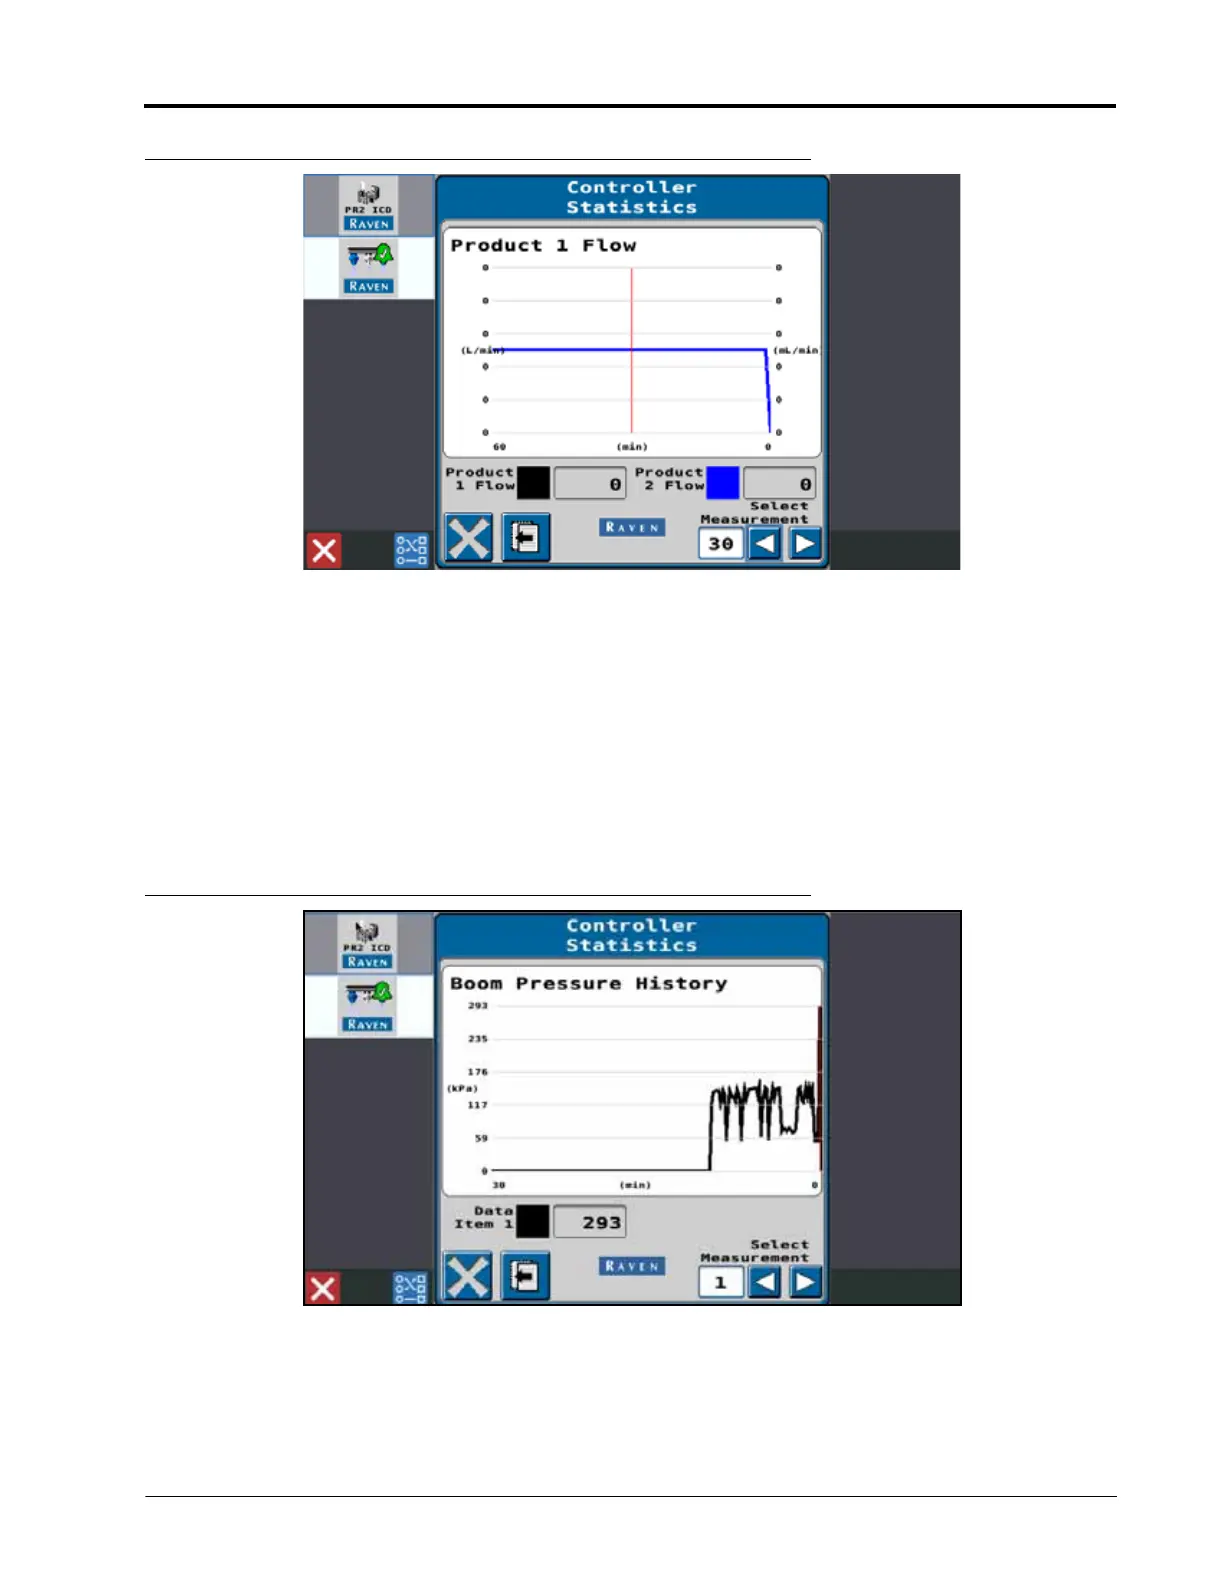
FIGURE 8. Data Visualization
Use the Select Measurement arrows in the lower, right corner of the page to adjust the data range. The red line
displays the sample time for the volume injected and applied through the boom. When no flow is detected, the
visualization line will pass through the center of the chart.
NOTE: Touch the Previous Page button to return to the Controller Statistics data setup page to select other
data variables to visualize. Touch the X in the lower, left corner of the Controller Statistics page to
return to the RCM-Sprayer main page.
Alternatively, select the Boom Pressure History option to visualize boom pressure for up to 1 hour spraying with
samples from every 10 seconds.
FIGURE 9. Data Visualization
 Loading...