RIGOL Chapter 19 Bode Plot
19-6 MSO5000 User Guide
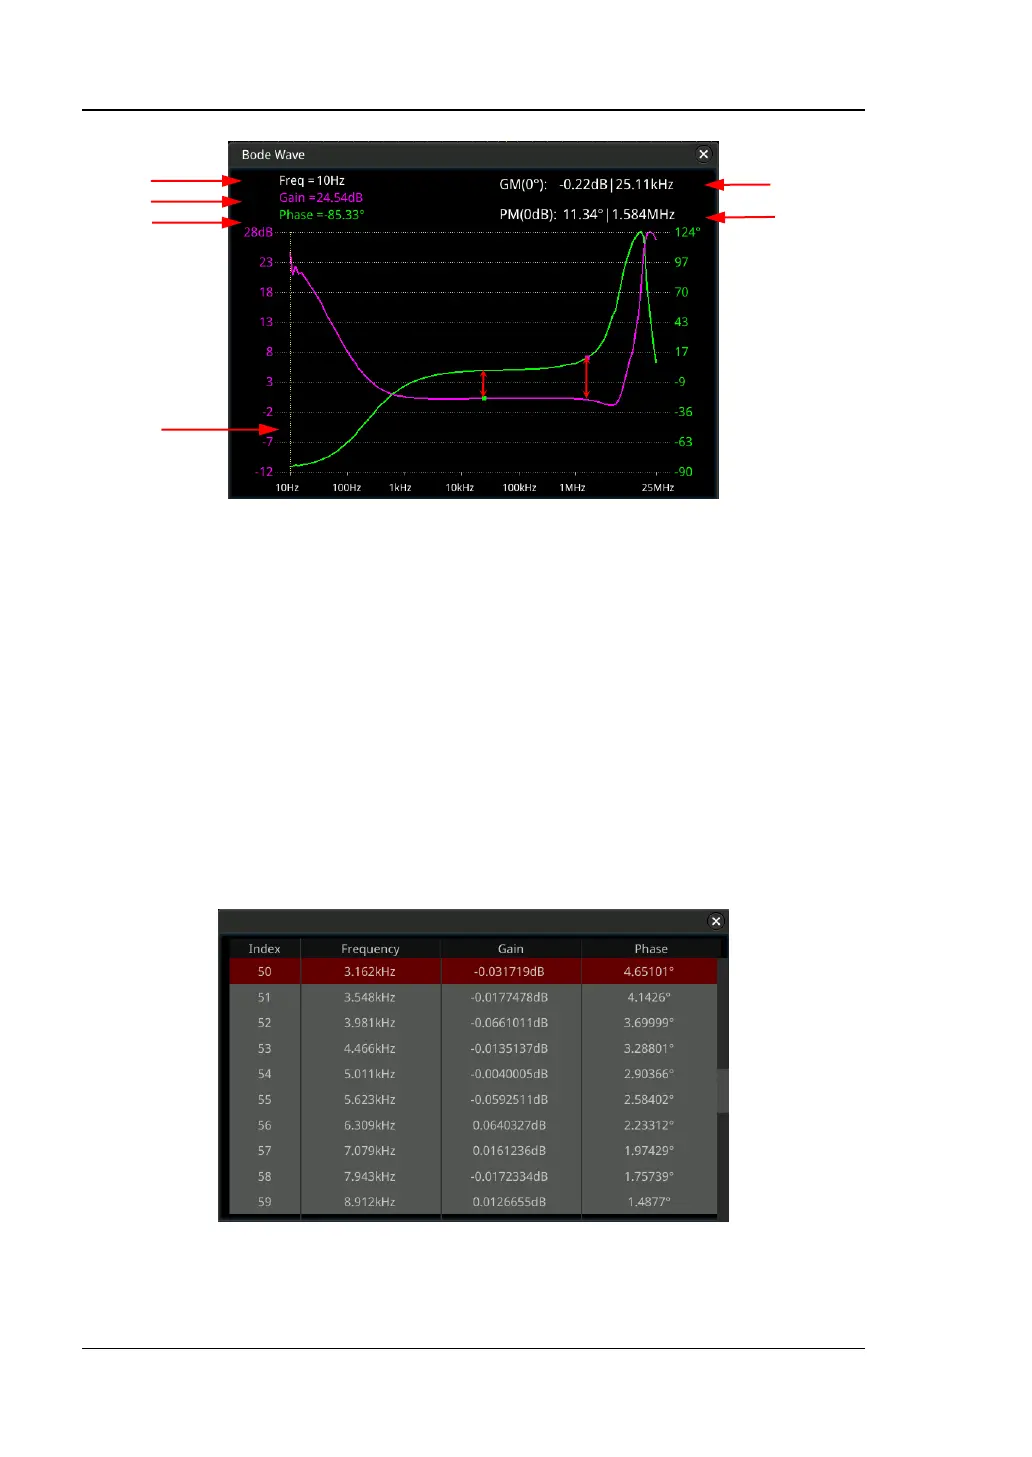
1. Frequency: indicates the X-axis value of the cursor in the bode plot.
2. Gain: indicates the Y-axis value of the crossover point between the cursor and
the purple curve.
3. Phase: indicates the Y-axis value of the crossover point between the cursor and
the green curve.
4. Cursor: for details, refer to "Cursor" section in this chapter.
5. GM: gain margin. It is the gain measurement difference between the value at 0
dB and the frequency point at 0-degree phase. GM = 0 dB - Gain Measurement
Result
6. PM: phase margin. It is the difference in phase between the phase at 0 dB gain
frequency point and 0-degree phase.
Chart