4
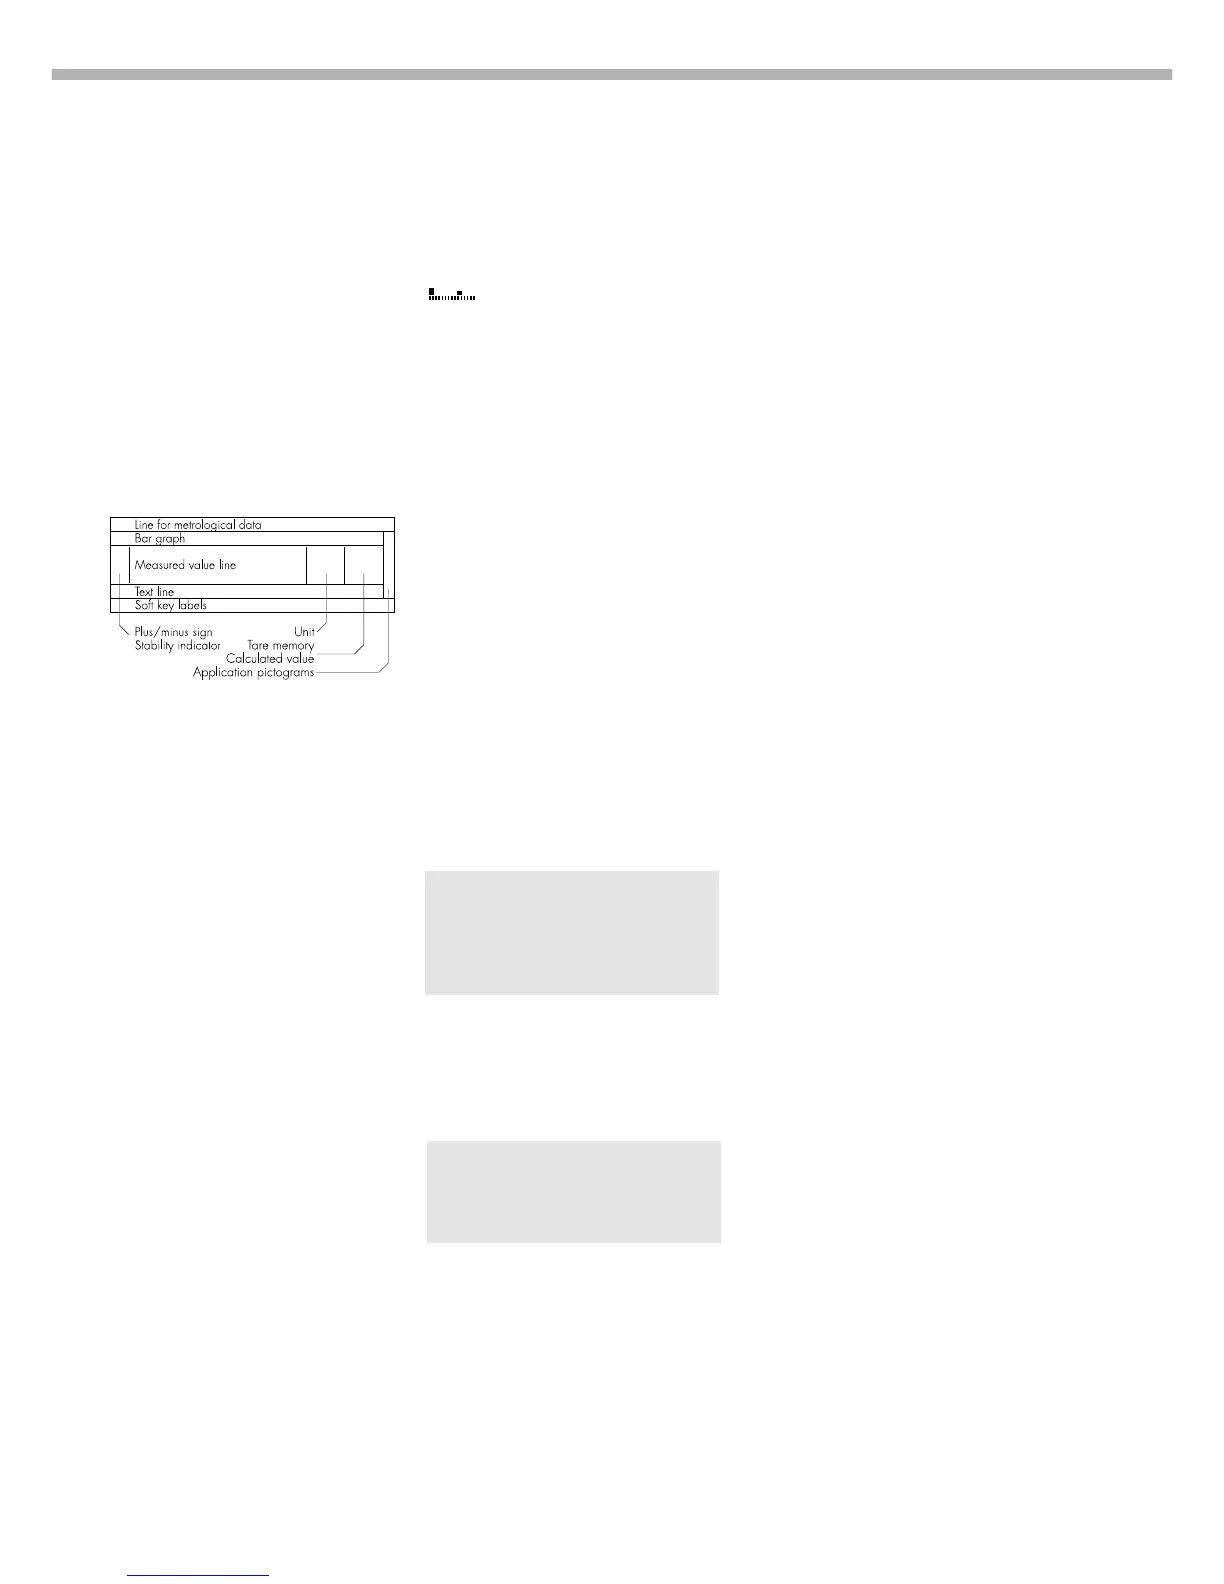
Tare Memory, Calculated Values:
The symbols displayed here indicate
when there is a value in one of the
tare memory modules or when the
value shown is a result of calculation
rather than direct measurement.
These symbols are as follows:
a Calculated value
s1 Tare memory used by an
s2 application program (e.g.,
formulation, second tare)
Application Pictograms:
The pictograms displayed here
indicate the application(s) selected.
The pictogram is displayed inversely
when the corresponding application
is active.
For example, the following symbols
may be displayed simultaneously:
A The counting application
is active
H Checkweighing is also active
S Print
T Data record
Text Line:
Additional information is displayed
here (e.g., operator guidance
prompts, name of the active program,
etc.)
Soft Key Labels:
The current functions of the soft keys
are indicated here; during
calibration/adjustment, this line
shows up- and down-arrows (Q
and q) for selecting calibration and
adjustment functions.
Display
There are two fundamentally different
types of display:
– display of measured and
calculated values
– display for menu parameter
settings (setup)
Display of Measured and
Calculated Values
This display is divided into
nine sections.
Line for Metrological Data:
When used in legal metrology, the
following metrological specifications
are shown here:
Max Maximum capacity of
the balance
Min Minimum capacity of the
balance; i.e., the minimum
weight allowed when
the balance is used in
legal metrology
e Verification scale interval
of the balance
d Readability: indicates the scale
interval of the balance
On standard balances, only Max
and d are shown.
Bar Graph:
The bar graph indicates how much
of the balance’s capacity is
“used up” by the current load;
uring checkweighing, it indicates
the control limits.
The following symbols may be
displayed here:
0% Lower load limit
100% Upper load limit
Bar graph showing 10%
intervals
- Minimum for checkweighing
= Target for checkweighing
+ Maximum for checkweighing
Plus/Minus Sign, Stability Symbol:
A plus or minus sign (F or H) is
shown here for a weight value (e.g.,
a calculated value when weighing
in percent) or the S symbol, indicating
that the verified or verifiable balance
has been zeroed or tared.
Measured Value Line:
This section shows the weighed or
calculated value or alphanumeric
input.
Note Concerning Verified Balances
Approved for Use as Legal Measuring
Instruments in the EU*:
For verified balances that have
a verification scale interval e
which is greater than the scale
interval d, the last digit on the
display is bordered.
Unit and Stability:
When the balance reaches stability,
the weight unit or calculation unit is
displayed here.
When the a symbol is
displayed here, the value indi-
cated in the readout cannot be
used in legal metrology.
* including the Signatories of
the Agreement on the European
Economic Area


 To Next Page