50
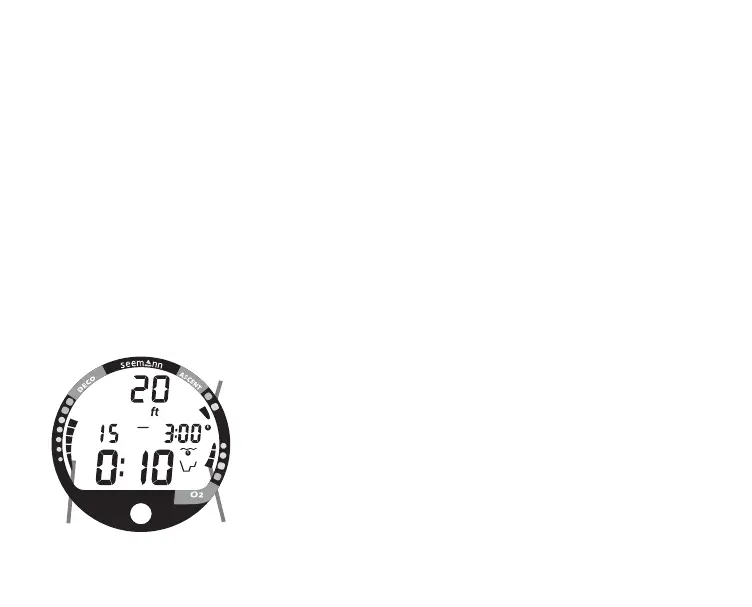
DIVE MODE BAR GRAPHS
As your depth and elapsed dive time increase, the Nitrogen Bar Graph (Fig. 43a) will
fill with segments (green toward red) to represent the absorption of nitrogen.
While ascending to shallower depths, the segments that have filled the Nitrogen Bar
Graph will begin to recede, offering a graphic representation of your multilevel diving
capability. If FO2 was set for a numerical value (nitrox), the O2 Bar Graph (Fig. 43b)
will fill with segments (green toward red) to represent oxygen accumulation for that
dive or 24 hour period, whichever amount is greater.
The Variable Ascent Rate Indicator (Fig. 43c) shows how fast you are ascending.
When you exceed the maximum recommended ascent rate for the depth you are at, it
will enter the red (Too Fast) zone and you will be alerted by all segments of the bar
graph flashing, and an Audible alarm (unless set OFF). The warnings will stop when
your ascent rate is slowed.
CONTROL OF DISPLAYS
During No Decompression conditions, various displays of
information (up to 4) are available. Each provides Depth,
Dive Time Remaining, and additional information. The intent
of this feature is to provide the diver control of how much
information is on display at any given time during the dive.
The diver can change from one display to another as often
as desired by pressing the Advance (Front) button, other-
wise it does not change.
Fig. 43 - Bar Graphs
b
c
a