Appendix A: Trip Curves & Equations
Siemens Energy & Automation, Inc. 57
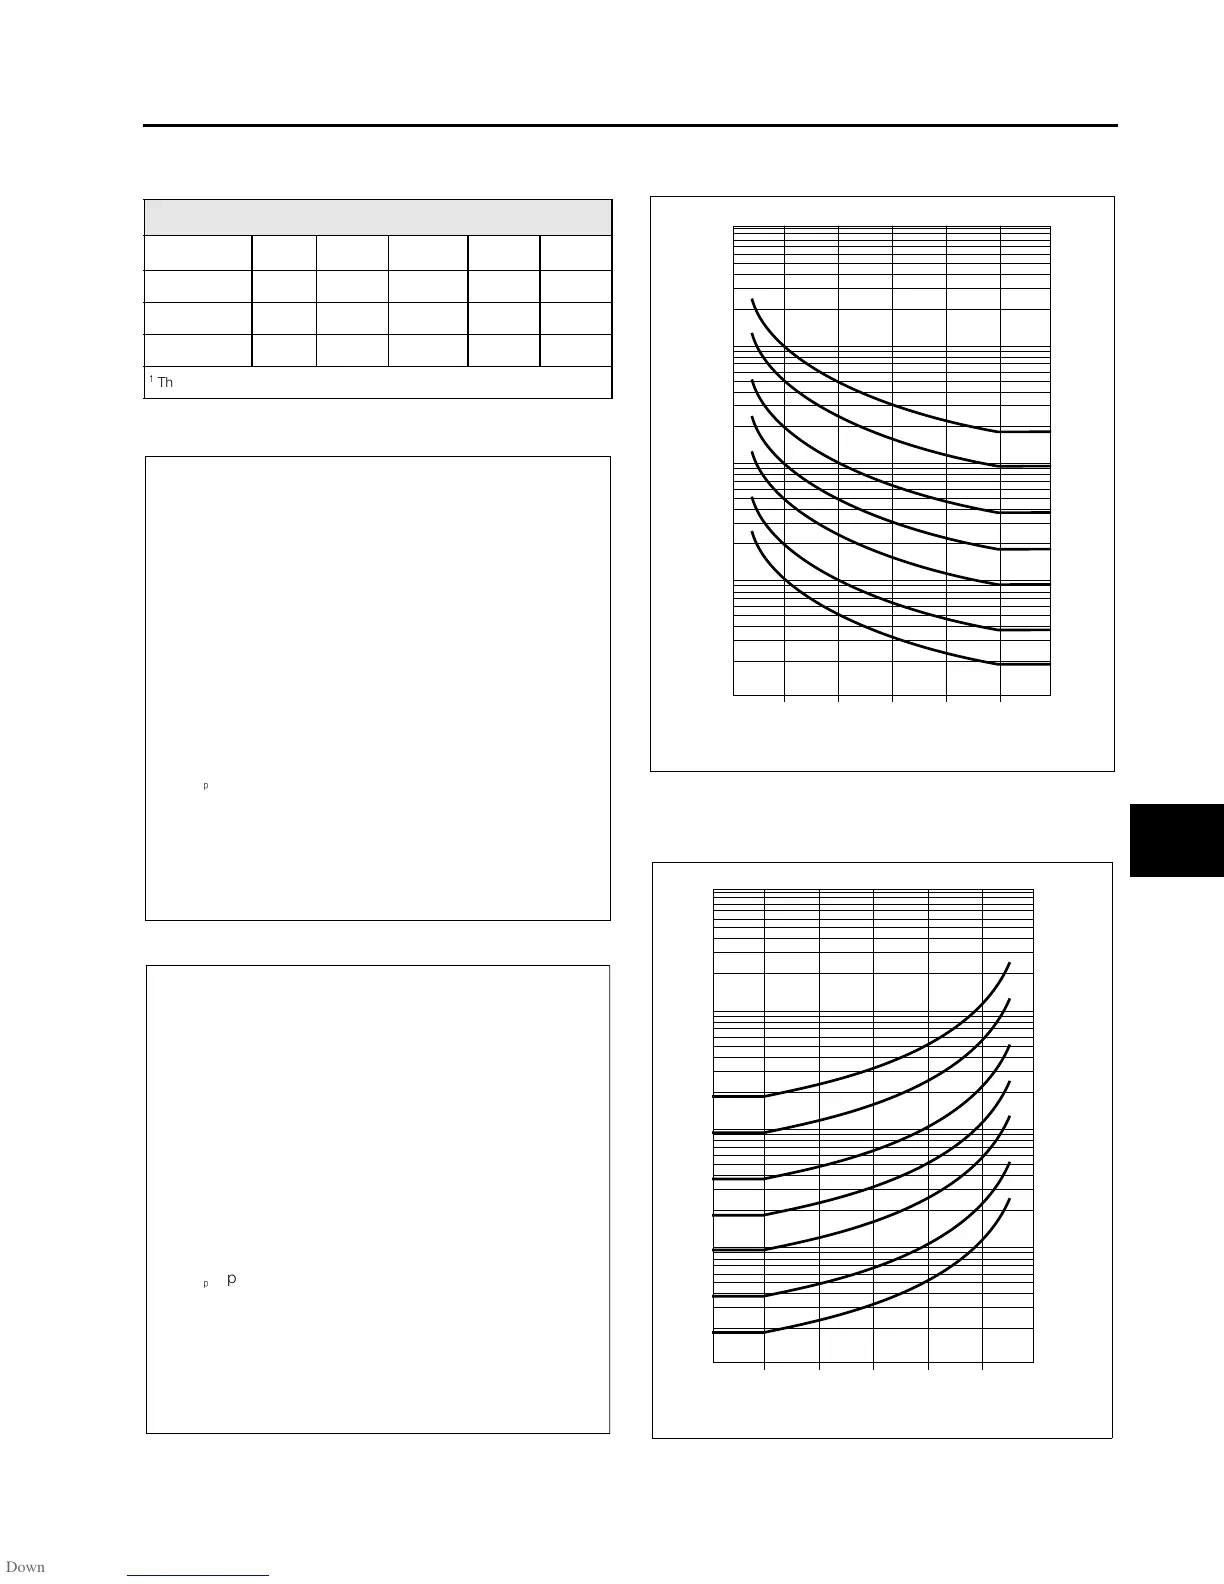
Table A.2 Under/Overvoltage Coefficients
Equation A.5 Overvoltage Equation
Equation A.6 Undervoltage Equation
Over/Undervoltage Coefficients
Curve Type Des.
A
1
B
1
N
1
t
r
Inverse 0.51 -1.75 0.50 ---
Mod. Inverse 0.51 -0.45 0.50 ---
Very Inverse 0.51 1.75 0.50 ---
1
The A, B, and N coefficients are for the standard relay formula
T = time to trip, in seconds
v = measured input voltage
v
p
= pickup value (tap setting)
= multiple of pickup setting
D = time dial setting, 0.1 to 9.9 in steps of 0.1
A, B, N
= constants for inverse curves
For1.01
v
v
p
-----
1.5: T
AD
v
v
p
-----
N
1–
-------------------------BD+=≤≤
For
v
v
p
-----
1.5: T
AD
1.5
)(
N
1–
--------------------------BD+=>
v
v
p
------
T = time to trip, in seconds
v = measured input voltage
v
p
= pickup value (tap setting)
= multiple of pickup setting
D = time dial setting, 0.1 to 9.9 in steps of 0.1
A, B, N
= constants for inverse curves
For 0.5
v
v
p
-----
1.5: T
AD
v
v
p
-----
N
1–
-------------------------BD+=≤≤
For
v
v
p
-----
0.5:
T
AD
1.5
)(
N
1–
--------------------------BD+=≤
v
v
p
------
Figure A.11 Moderately Inverse Overvoltage Curve
Figure A.12 Moderately Inverse Undervoltage Curve
Multiples of Pickup
Time to Trip (Seconds)
Time Dial
1000
100
10
1
0.1
9.9
5.0
2.0
1.0
0.5
0.2
0.1
1 1.1 1.2 1.3 1.4 1.5 1.6
Multiples of Pickup
Time to Trip (Seconds)
Time Dial
1000
100
10
1
0.1
9.9
5.0
2.0
1.0
0.5
0.2
0.1
0.4 0.5 0.6 0.7 0.8 0.9 1.0
A
isv3o_1.bk : isv3ocrv.frm Page 57 Wednesday, August 7, 1996 10:51 AM
 Loading...