14
Grid Tied PV System with Battery Backup – User Manual
Version UM1142-PV-BT-v1.0 © solarcity 2019
5.5 Monitoring with the solarZero app
The solarZero app consists of a set of simply to navigate screens to monitor the power flows in your household.
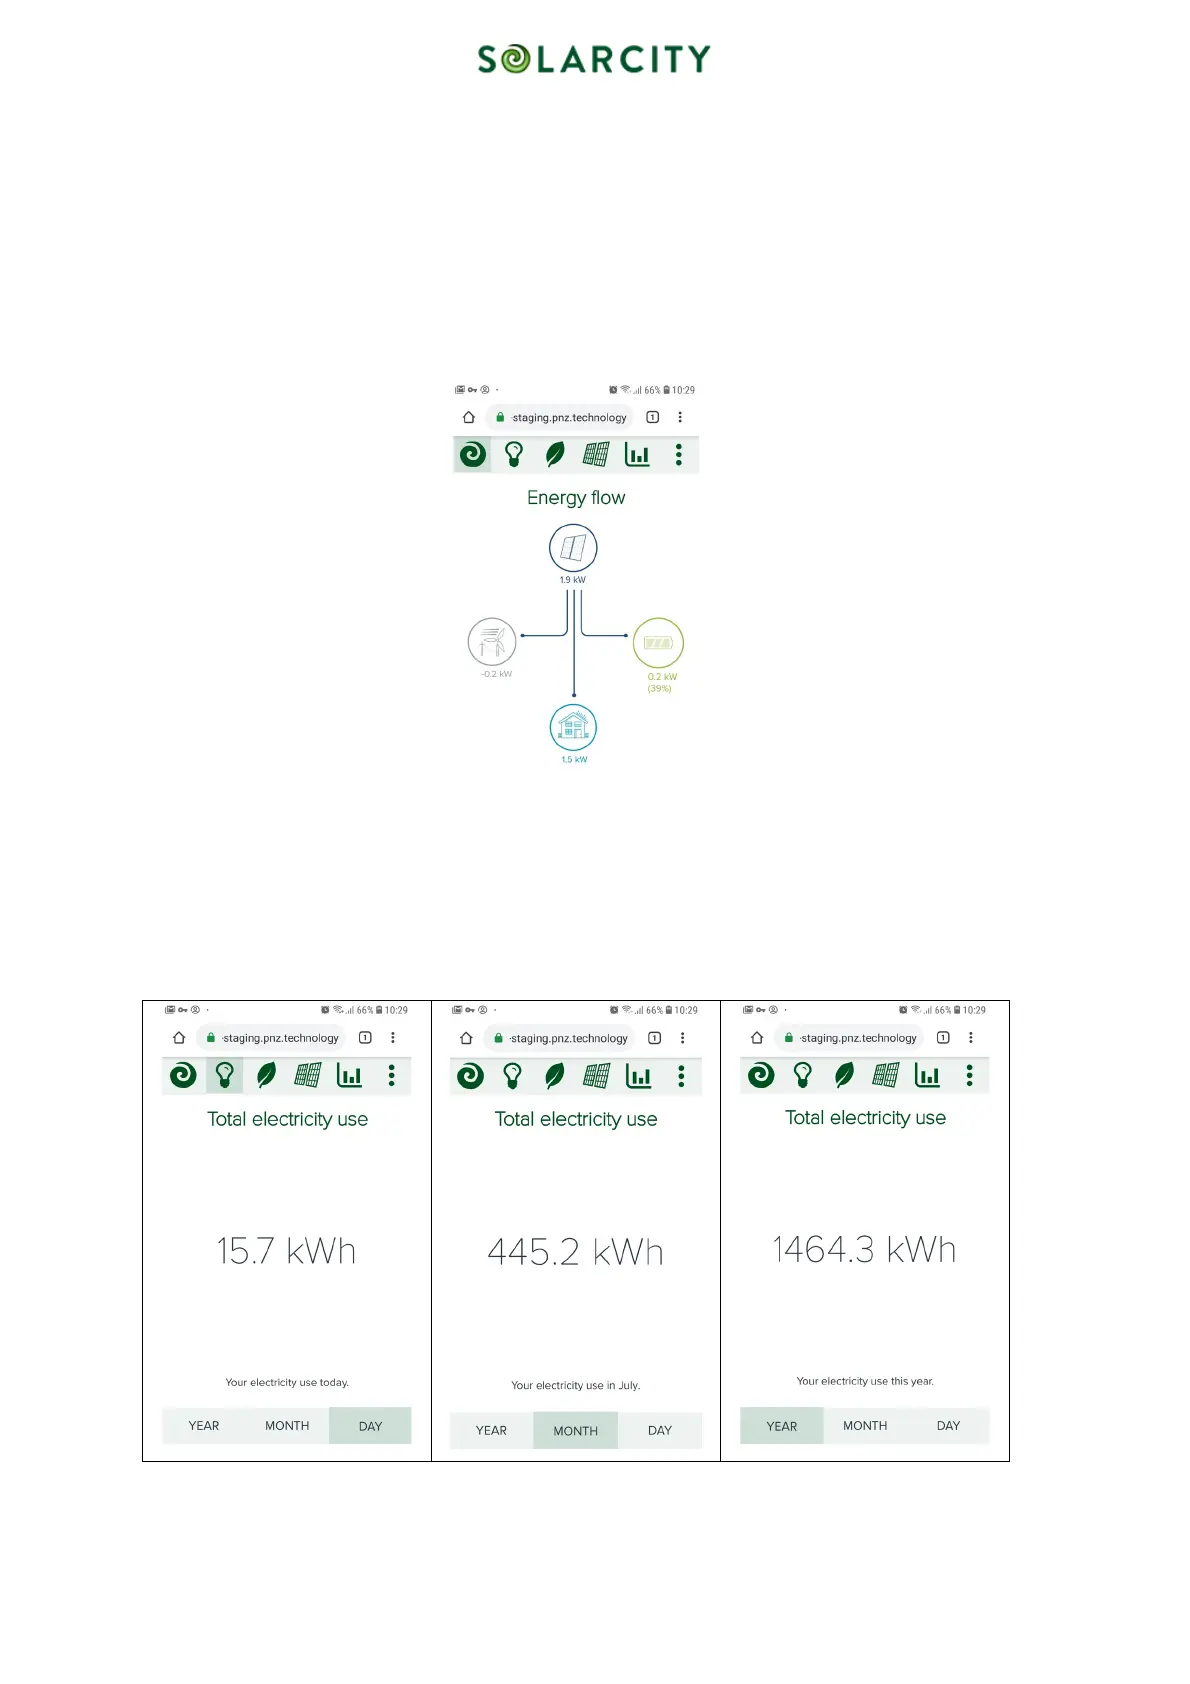
5.5.1 Energy flow
This animated screen shows four icons, representing the solar panels, the battery, the loads in your home and the electricity grid. Lines
appear and disappear depending on an existing power flow and the moving dots along the lines indicate the flow direction of the
energy.
Figure 5: Energy Flow
5.5.2 Total electricity use
The next screen shows your total electricity use – both solar generated and grid imported – and lets you select by day,
month or year. The options “MONTH” and “YEAR” refer to the current calendar month and year accordingly.
Figure
6
: Total Electricity Use – Day, Month, Year