16
Grid Tied PV System with Battery Backup – User Manual
Version UM1142-PV-BT-v1.0 © solarcity 2019
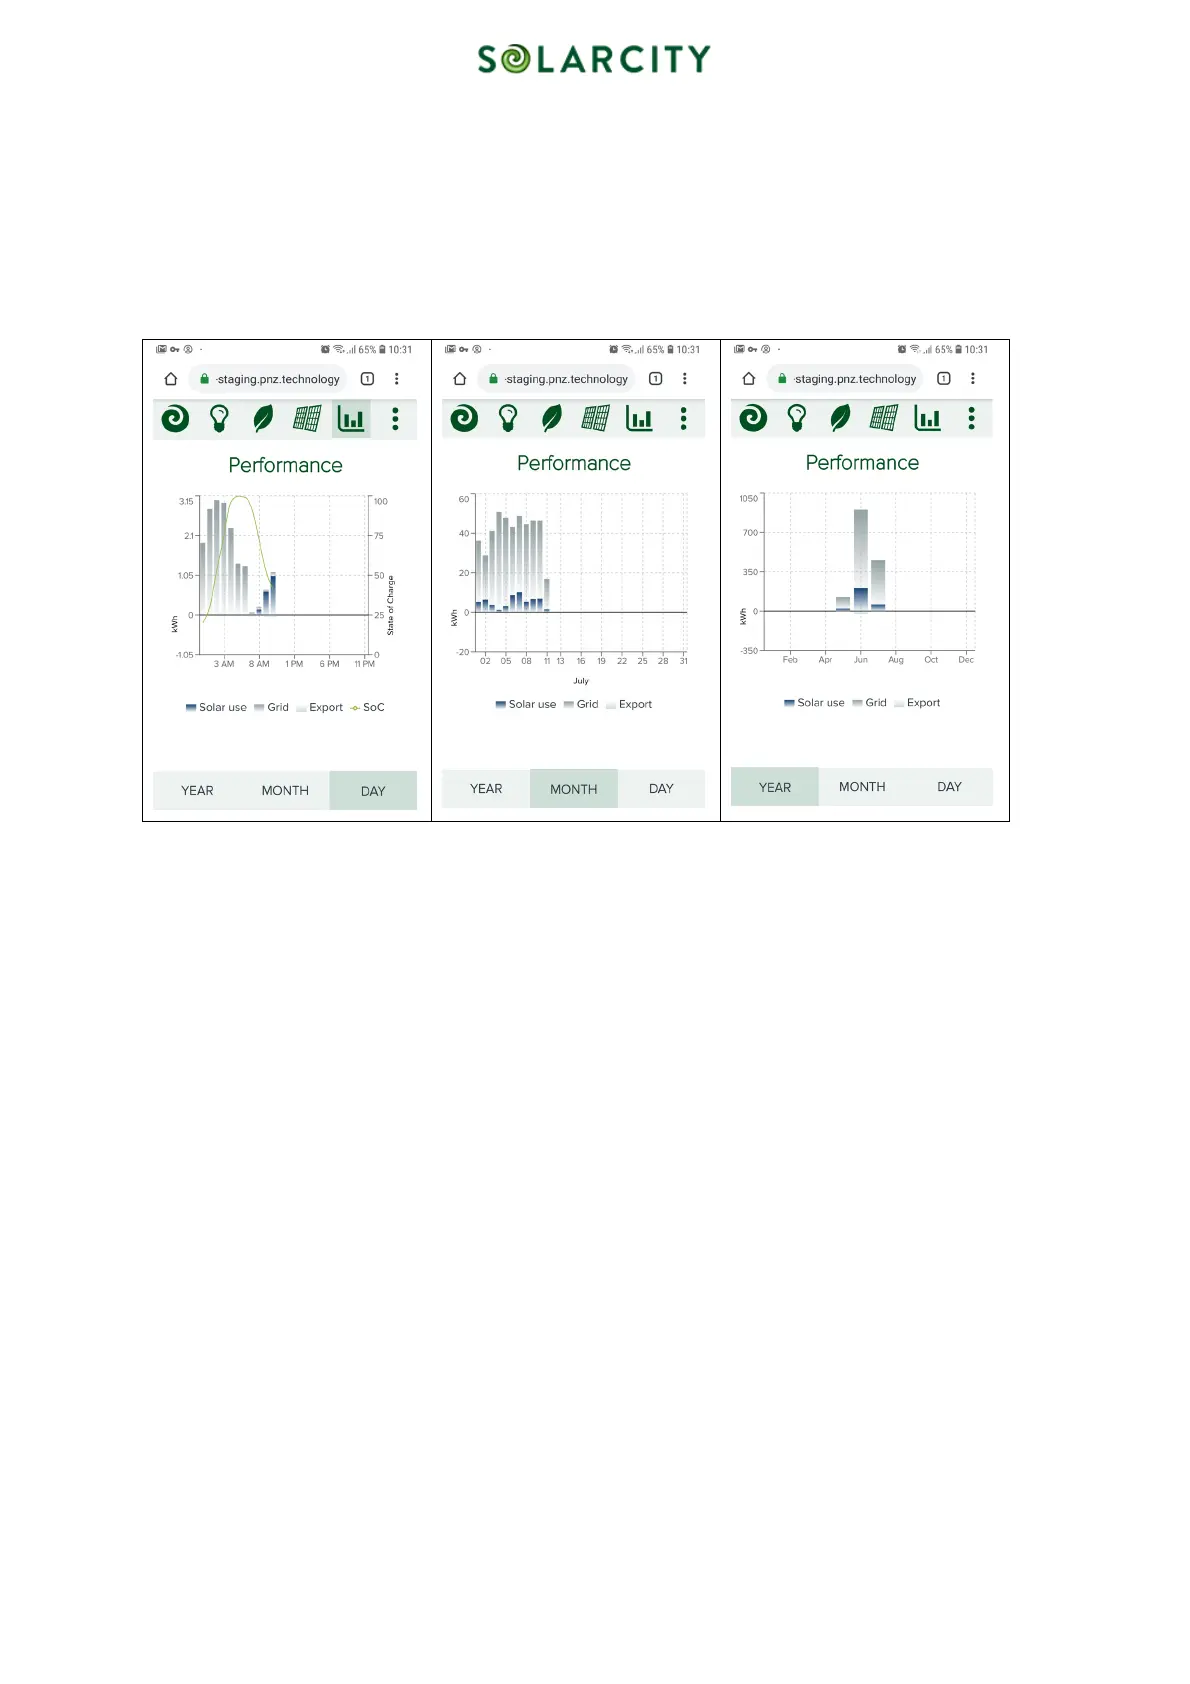
5.5.5 System Performance
This screen shows a bar chart with a representation of solar use, grid use and grid export. As in screens before, you can
select between the day, month and year options. All three have a left vertical axis in common with a kWh-scale.
Imported grid power and solar power used by appliances in your home are displayed as positive values. Any solar
energy exported into the grid is shown as negative values.
The “DAY” view has an additional value displayed called State of Charge (SoC – vertical axis to the right). It ranges
from 0% to 100% and represents the amount of usable energy currently stored in the battery, relative to its maximum.
The horizontal axis is divided into hours, days and months for the “DAY”, “MONTH” and “YEAR” view accordingly
Figure 9: Performance – Day, Month, Year
5.5.6 Detail views
Besides the bar charts described before, there are detailed line graph views available for the current day and month. You
can navigate there by selecting the rightmost icon on the top navigation bar (three vertical dots) and then select
“DETAIL”.
The vertical axis to the left again displays the kWh. The horizontal axis displays the hours in the day-view and the days
in the month-view.
Both views display the following recorded values:
• Solar – Solar generation of the panels on your roof
• Grid – Imported grid power
• Export – Excess of generated solar power that has been exported into the grid
The day-view also displays
• Charge – Power used to charge the battery
• Discharge – Energy discharged from the battery
• SoC – State of Charge. This value represents the amount of electric energy stored in your battery in relation to the
maximum energy that can be stored in the battery. The value ranges from 0% to 100%