5
Sookook Corporation
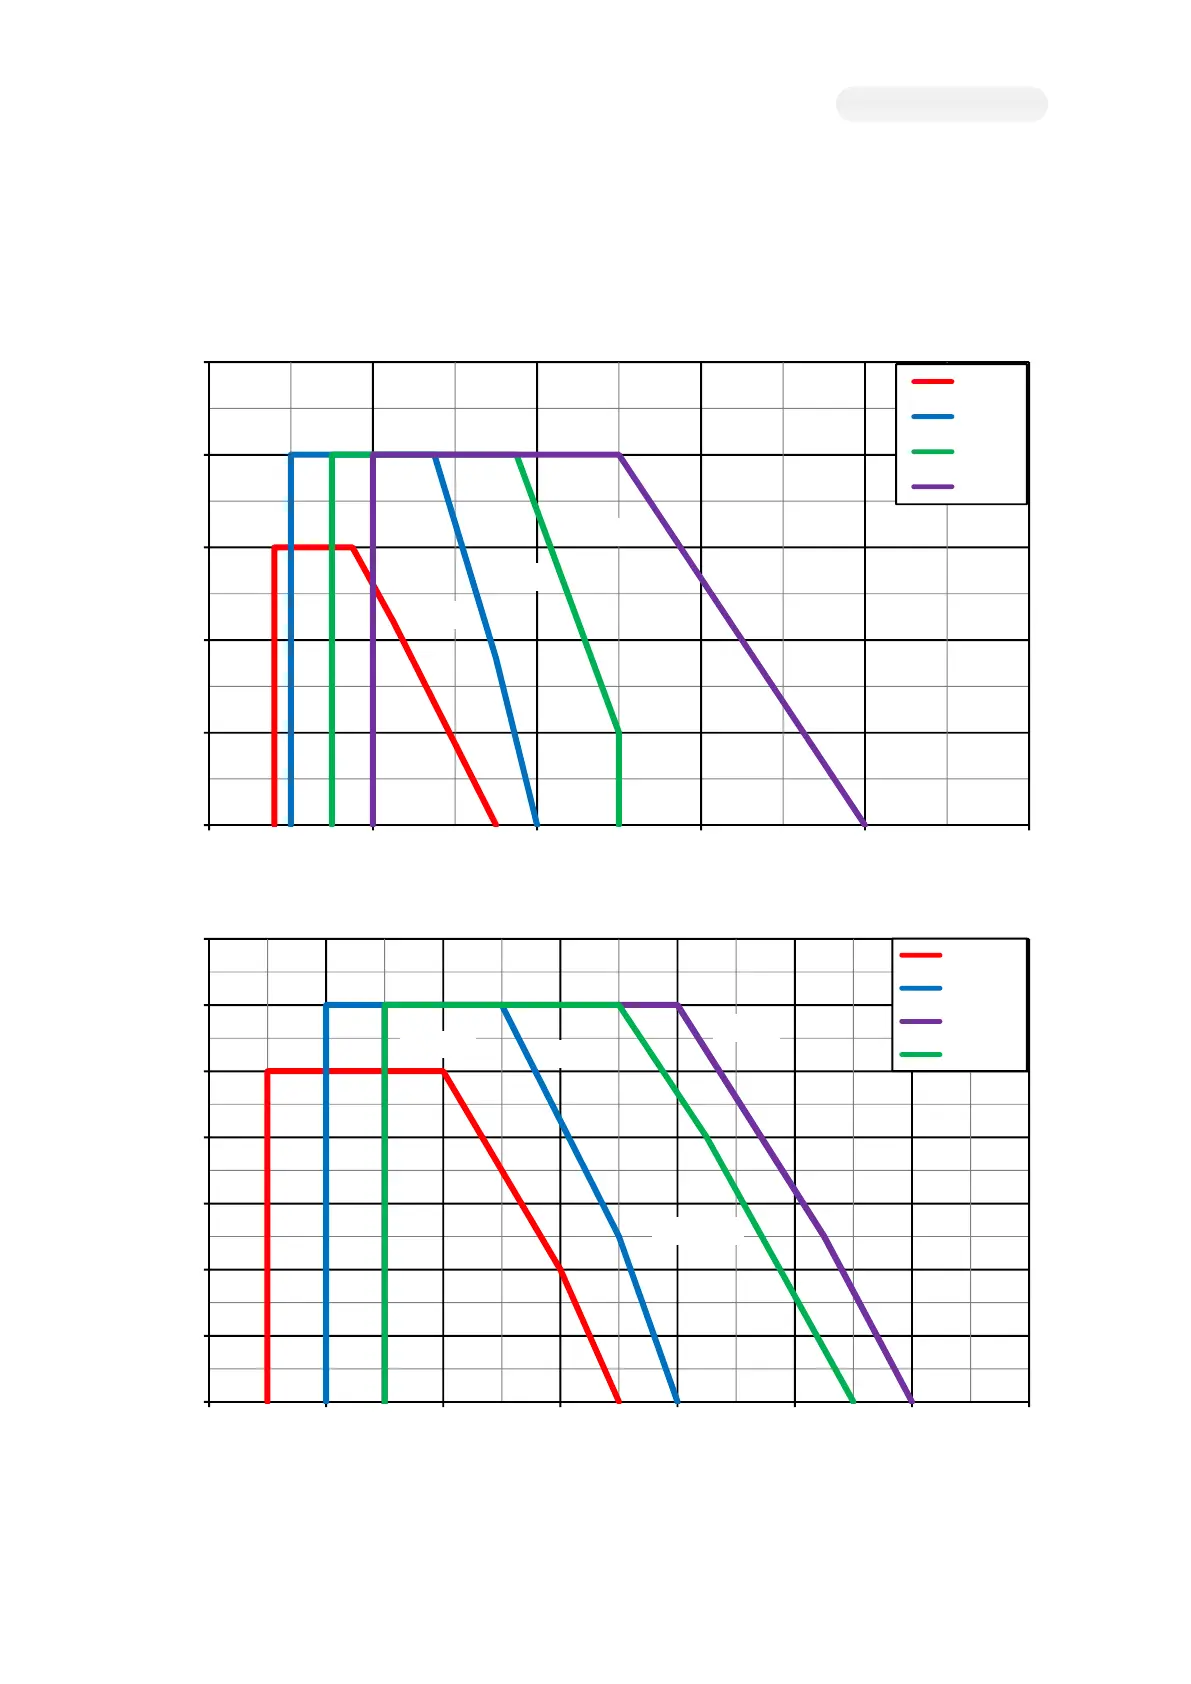
1C. Burner Performance Curve
The below chart shows the range of burner safety usage in accordance with combustion safety standards.
Depending on the burner capacity, there may be a deviation from the initial furnace pressure, and the deviation is not the same for each
boiler. Because there is no strict correlation between the initial furnace pressure and normal furnace pressure, the below chart shall be used
as a reference.
[Figure 1C-A. MAXI 5 – MAXI 16 Performance Curve (60Hz)]
[Figure 1C-B. MAXI 20S – MAXI 25 Performance Curve (60Hz)]
0
1
2
3
4
5
0 4 8 12 16 20
Combustion Chamber Pressure [mbar]
Burner Output - 4% O2 [10,000*kcal/h]
MAXI 5
MAXI 8
MAXI 10
MAXI 16
MAXI 5
MAXI 8
MAXI 10
MAXI 16
0
1
2
3
4
5
6
7
4 8 12 16 20 24 28 32
Combustion Chamber Pressure [mbar]
Burner Output - 4% O2 [10,000*kcal/h]
MAXI 20S
MAXI 20
MAXI 25
MAXI 25 LX
MAXI 20S
MAXI 20
MAXI 25 LX
MAXI 25