Studer Innotec SA
BSP
18 V1.0.3 User Manual
6. Display of the state of the battery
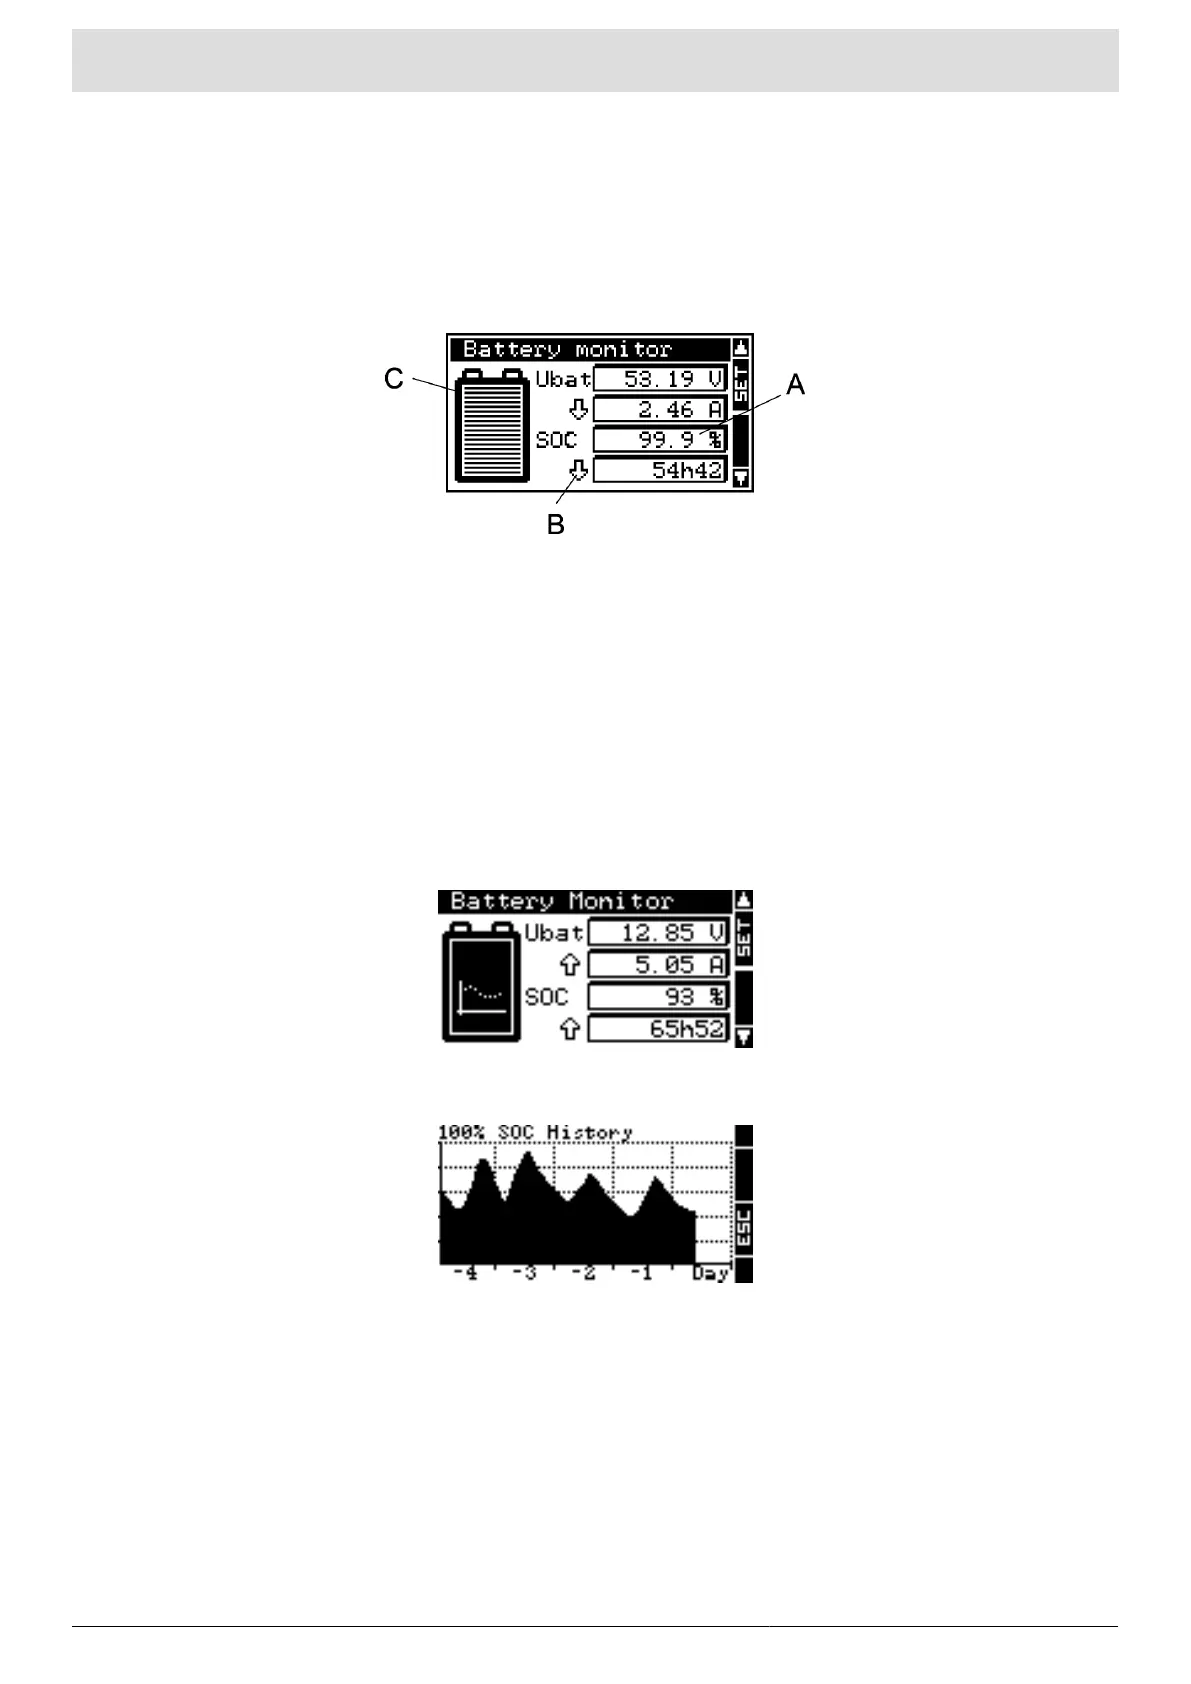
On installations with a BSP, the view over information on the battery of the Figure 6.1 is added to the RCC.
In area (A), four values of the BSP are displayed. The symbol of the battery in (B) gives an quick overview of
the state of charge (SoC). The direction of the current is given in (C). An arrow upwards means the charge,
downwards, the discharge.
Figure 6.1. View of the state of the battery
6.1. Graph of the state of charge history
It is possible to see the battery state of charge of the last 5 days on the RCC. On that purpose, from the view
over the battery information, you enter in selection mode with the key SET. The battery is then selected as
on the Figure 6.2. The key SET allows then to display the graph.
The graph of the state of charge of the Figure 6.3 is then displayed. On the horizontal scale are today and
the last 4 days. The graduations indicate every hour from midnight to midnight. Each horizontal pixel means
one hour. The vertical axis gives the state of charge of the battery. The graduations mean 20, 40, 60, 80 and
100 % and one pixel means 2 %.
Figure 6.2. View with selected battery
Figure 6.3. View of the state of charge history graph
6.2. Values to display
It is possible to modify the values to display on the battery view. For that, from the basic view of the Figure 6.1
push on SET. The battery is then selected as on the Figure 6.2. Go to the first value displayed with the key
DOWN. The keys UP and DOWN allow going to the field to configure. With the key SET, enter the menu
corresponding to the value to display.
Then, choose the value to display by means of UP and DOWN and push on SET to validate.