Add a plot of a measurement
Measurement plots let you graph the distribution of waveform data point occurrences (histogram), plot the frequency components
(spectrum) of a waveform, show the time trend of a measurement, and other supported plots. Available plots depend on the
measurement.
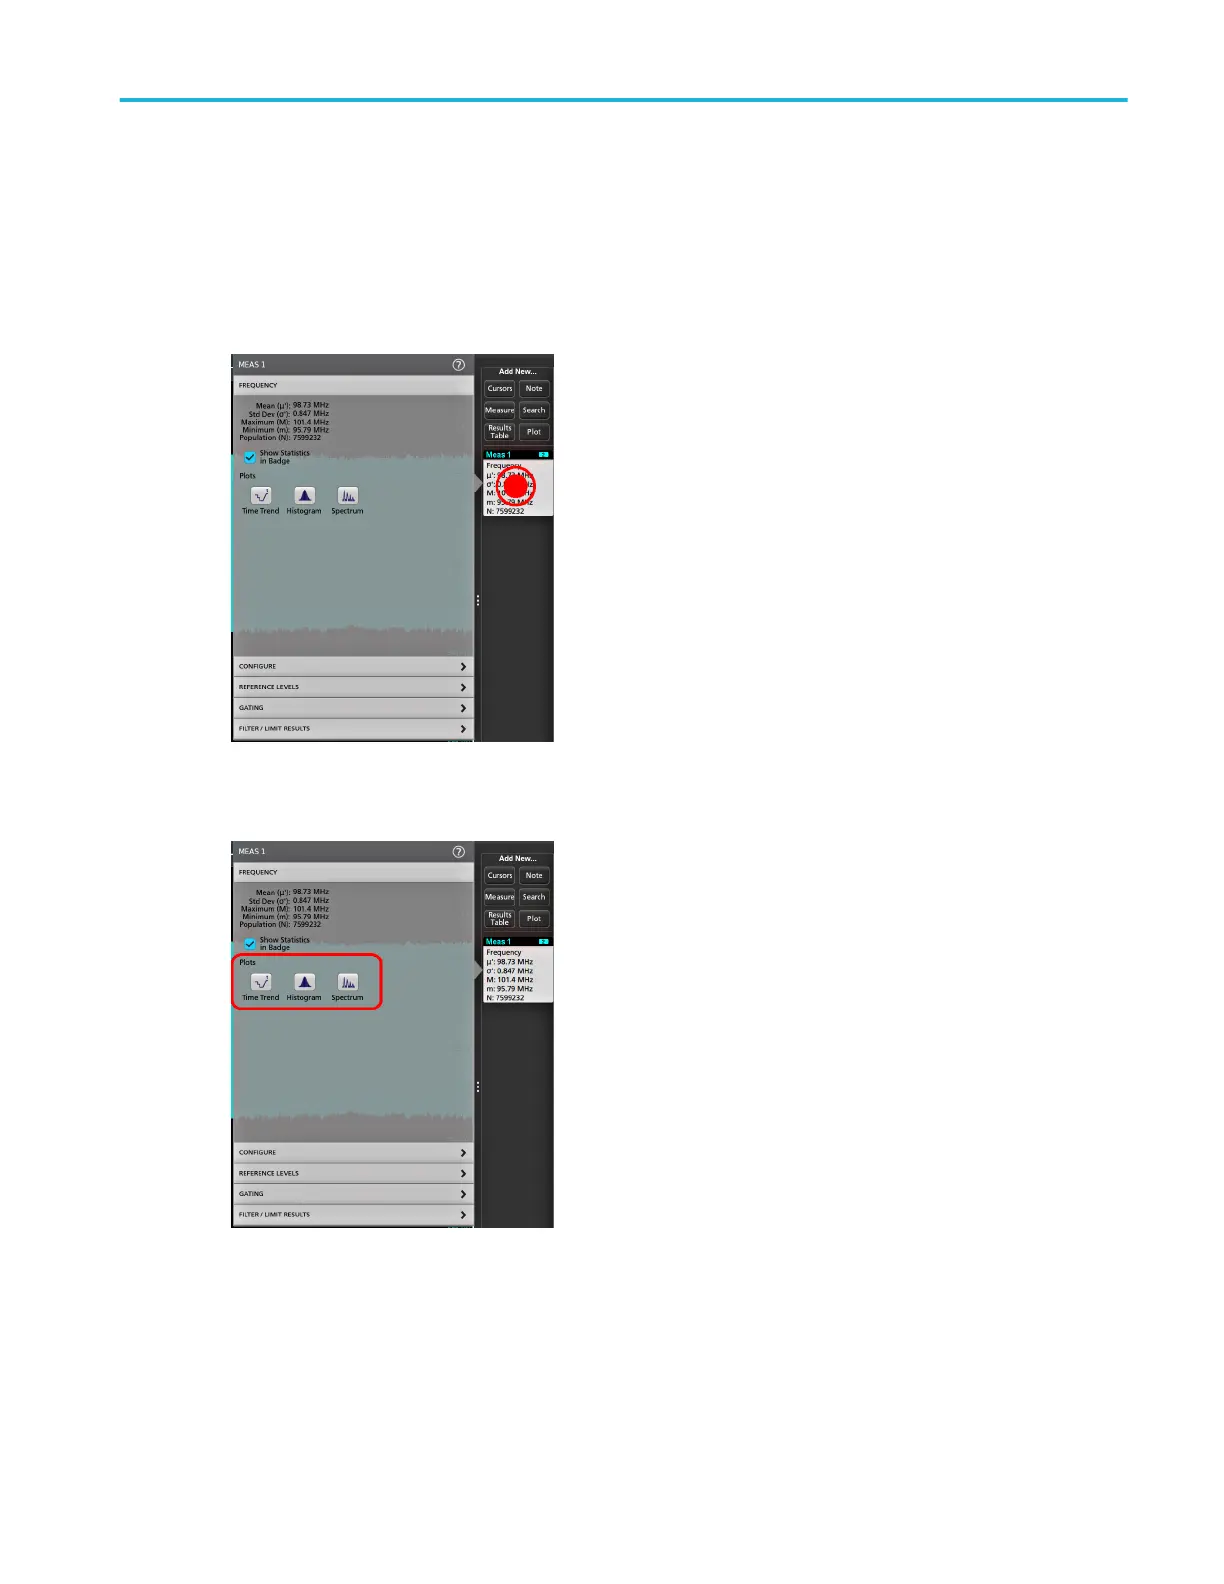
1. Double-tap a Measurement badge to open the Meas configuration menu.
2. Tap a Plots button to add that plot for the measurement to the screen.
The following shows adding a Histogram plot.
Operating basics
MSO44, MSO46 Installation and Safety Manual 45
ООО "Техэнком" Контрольно-измерительные приборы и оборудование www.tehencom.com
 Loading...