EasyManua.ls Logo

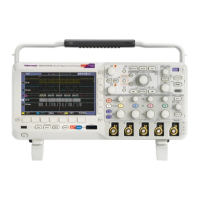
Tektronix MSO2012

Tektronix MSO2012
272 pages
To Next Page IconTo Next Page
To Previous Page IconTo Previous Page
Loading...
Analyze Waveform Data
Snapshot on 1
Period
+Width
Burst W
Rise
+Duty
+Over
High
Max
Ampl
Mean
RMS
Area
+Edges
+Pulses
: 312.2μs
: 103.7μs
: 936.5μs
:1.452μs
: 33.2 3%
:7.143%
:9.200V
: 10.4 0 V
: 16.8 0 V
: -5.396 V
:7.769V
:-21.58mVs
:7
:6
Freq
–Width
Fall
–Duty
–Over
Low
Min
Pk-Pk
CycleMean
CycleRMS
CycleArea
–Edges
–Pulses
: 3.203 kHz
:208.5μs
:1.144μs
: 66.77 %
:7.143%
:-7.600V
:-8.800V
:19.20V
:-5.396V
:8.206V
: -654.6μVs
:7
:6
High and Low Levels
The H igh-Low Method de termines the high (100%) and the low (0%) values of the waveform or gated region. For descriptions of
how me asureme nts use the high and low levels, refer to Selecting Automatic Measurements . (See page 174.)
184 DPO2000 and MSO2000 S eries Oscilloscopes User Manual

Table of Contents

Other manuals for Tektronix MSO2012

Related product manuals