Configure a measurement
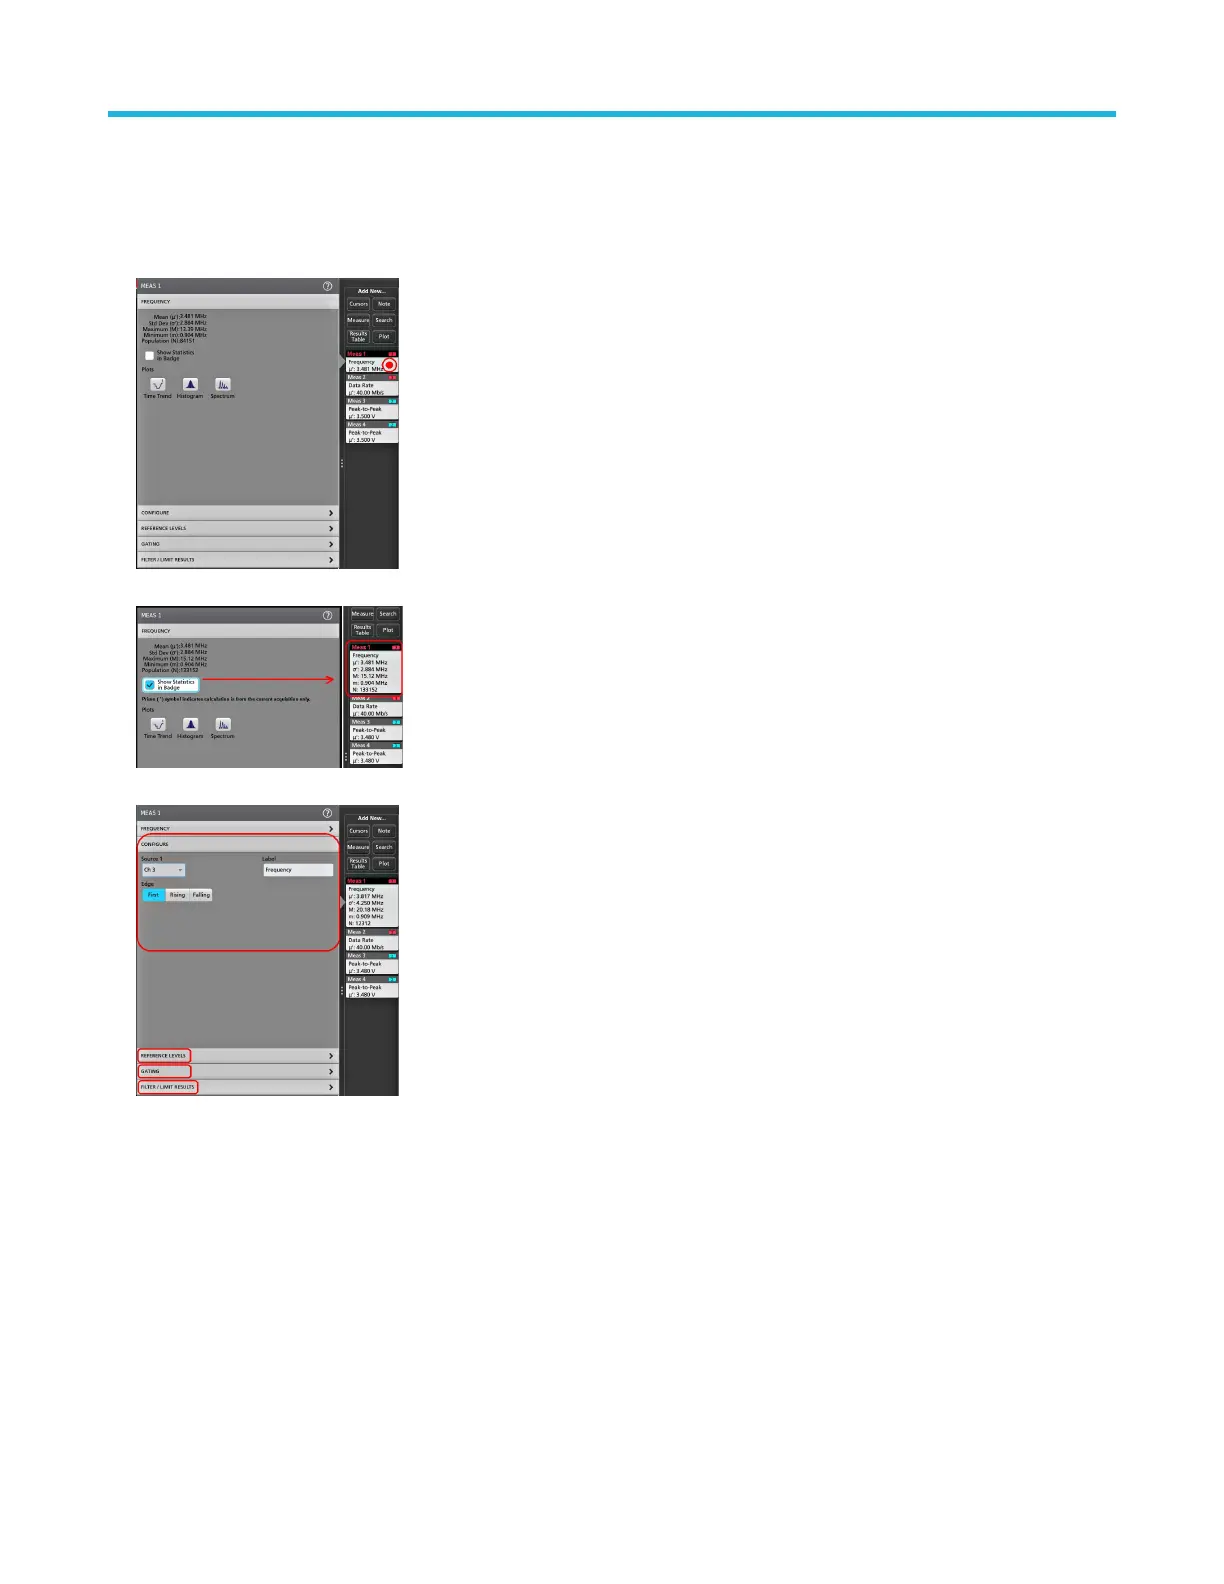
Use this procedure to add statistical readouts to the measurement badge, display plots for the measurement, and refine measurement
parameters (configuration, global versus local scope of settings, gating, filtering, and so on).
1. Double-tap a measurement badge to open its Measurement configuration menu.
2. T
ap Show Statistics in Badge to add statistical readouts to the measurement badge.
3. T
ap available panel titles to make changes for those categories.
4. Use the available fields to refine the measurement conditions. Displayed fields depend on the measurement. Selection changes take
ef
fect immediately. Selection changes can also change fields in other panels.
5. Tap the Help button on the menu title for more information on this menu's settings.
6. Tap outside the menu to close the menu.
Add a plot of a measurement
Measurement plots let you graph the distribution of waveform data point occurrences (histogram), plot the frequency components
(spectrum) of a waveform, show the time trend of a measurement, and other supported plots. Available plots depend on the measurement.
1. Double-tap a Measurement badge to open the Meas configuration menu.
Operating basics
54
 Loading...


