Monitoring Audi
o
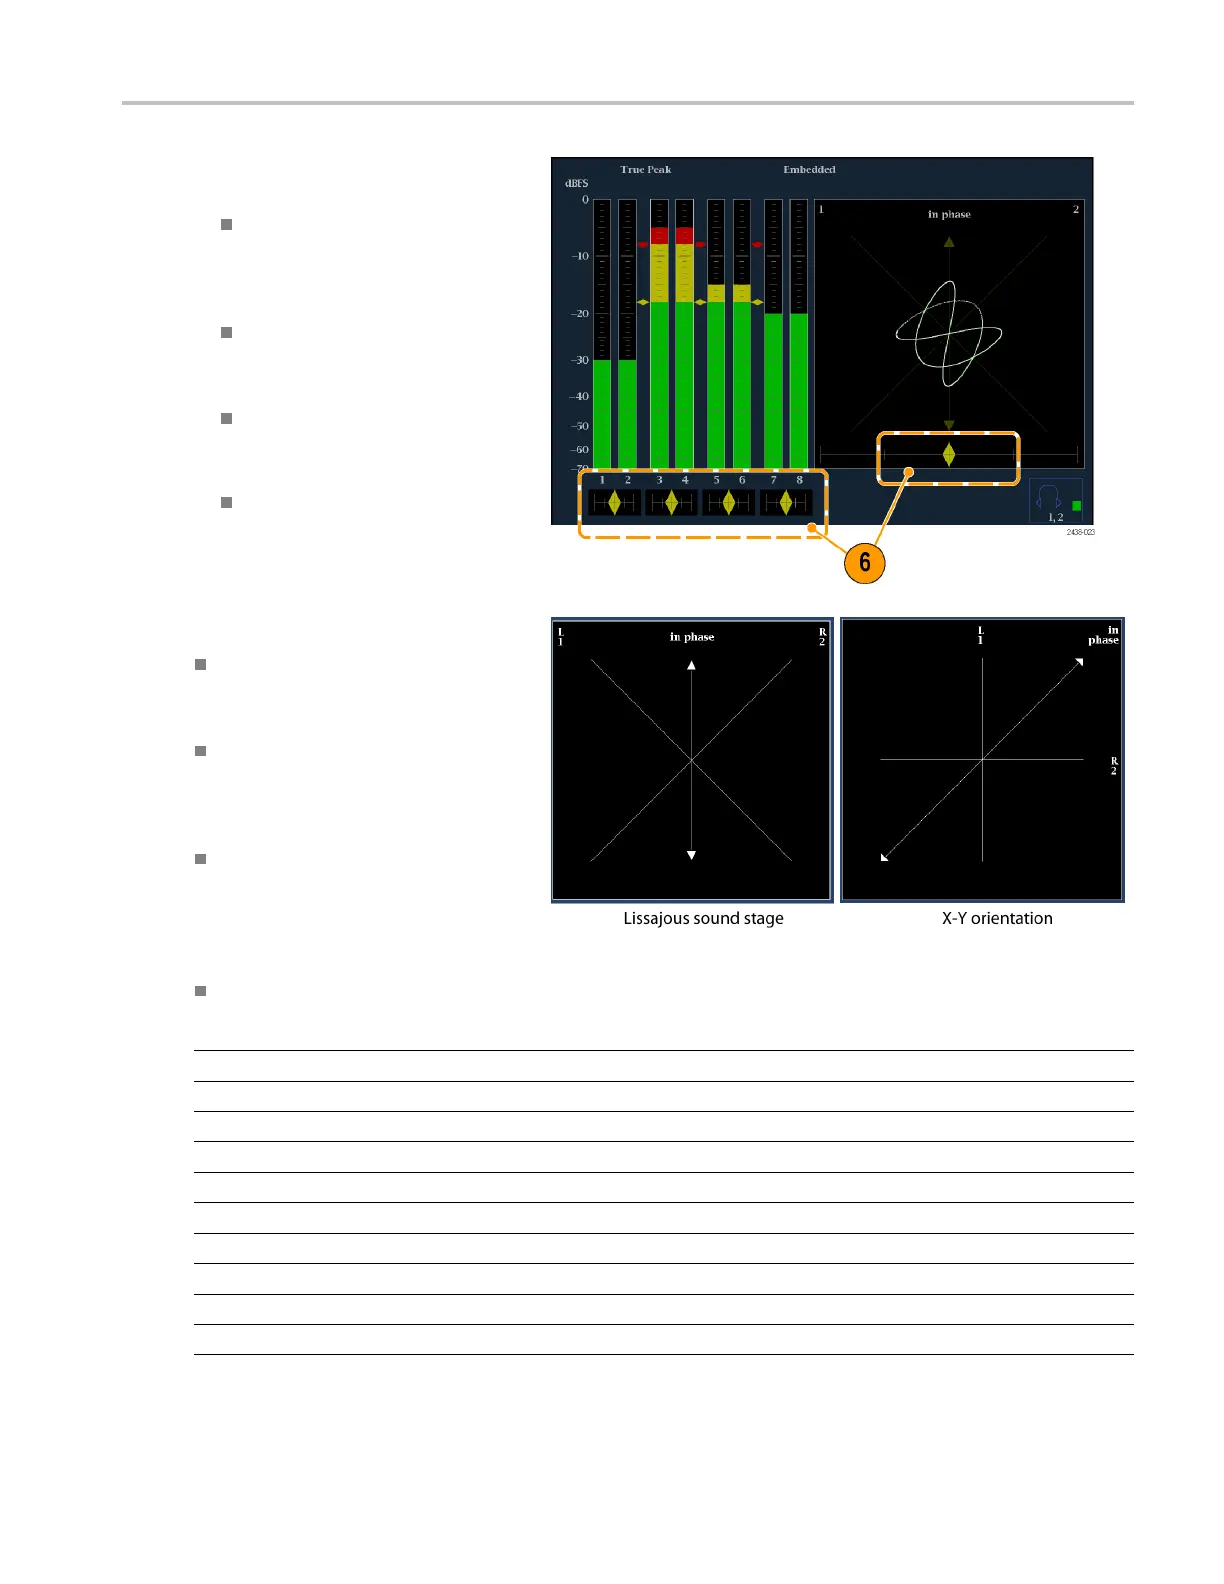
6. Check for Phase correlation of the
signals, noting the following:
Phase correlation meters are located
under the appr
opriate bars and
one is duplicated under the phase
display.
For correlated signals, the indicator
will be green
and will move to the
right.
For uncorrelated signals, the
indicator will be yellow and will tend
to stay in t
he middle.
For antico
rrelated signals (one goes
up when the other goes down), the
indicator will be red and will move
to the left
.
Usage Notes
The Lissajous or phase display is a plot
of one channel against another on an
orthogonal pair of axes.
Soundstage plots the two channels
at 45 degree angles, with the mono
combination appearing on the vertical
axis, like a left-right image in a s tudio.
X-Y plots left-channel data on the
vertical axis and right channel data on
the horizontal axis, emulating the X-Y
display of an oscilloscope.
The following response times of the correlation meters can b e set from the Configuration m enu.
Speed setting Response averaging time (s) Speed setting Response averaging time (s)
1 0.0167 11 3.0
2 0.0333 12 3.5
3 0.0667 13 4.0
4 0.1333 14 4.5
5
0.2667 15 5.0
6 0.5333 16
5.5
7
1.0 17 6.0
8 (default)
1.5 18 6.5
9 2.0 19 7.0
10 2.5 20
7.5
WFM4000 and WFM5000 Waveform Monitors User Manual 47
 Loading...