Using the EVM
www.ti.com
16
SBAU309A–February 2018–Revised June 2018
Submit Documentation Feedback
Copyright © 2018, Texas Instruments Incorporated
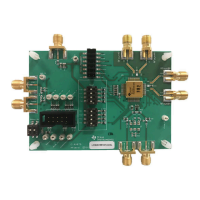
OPT3101 Evaluation Module
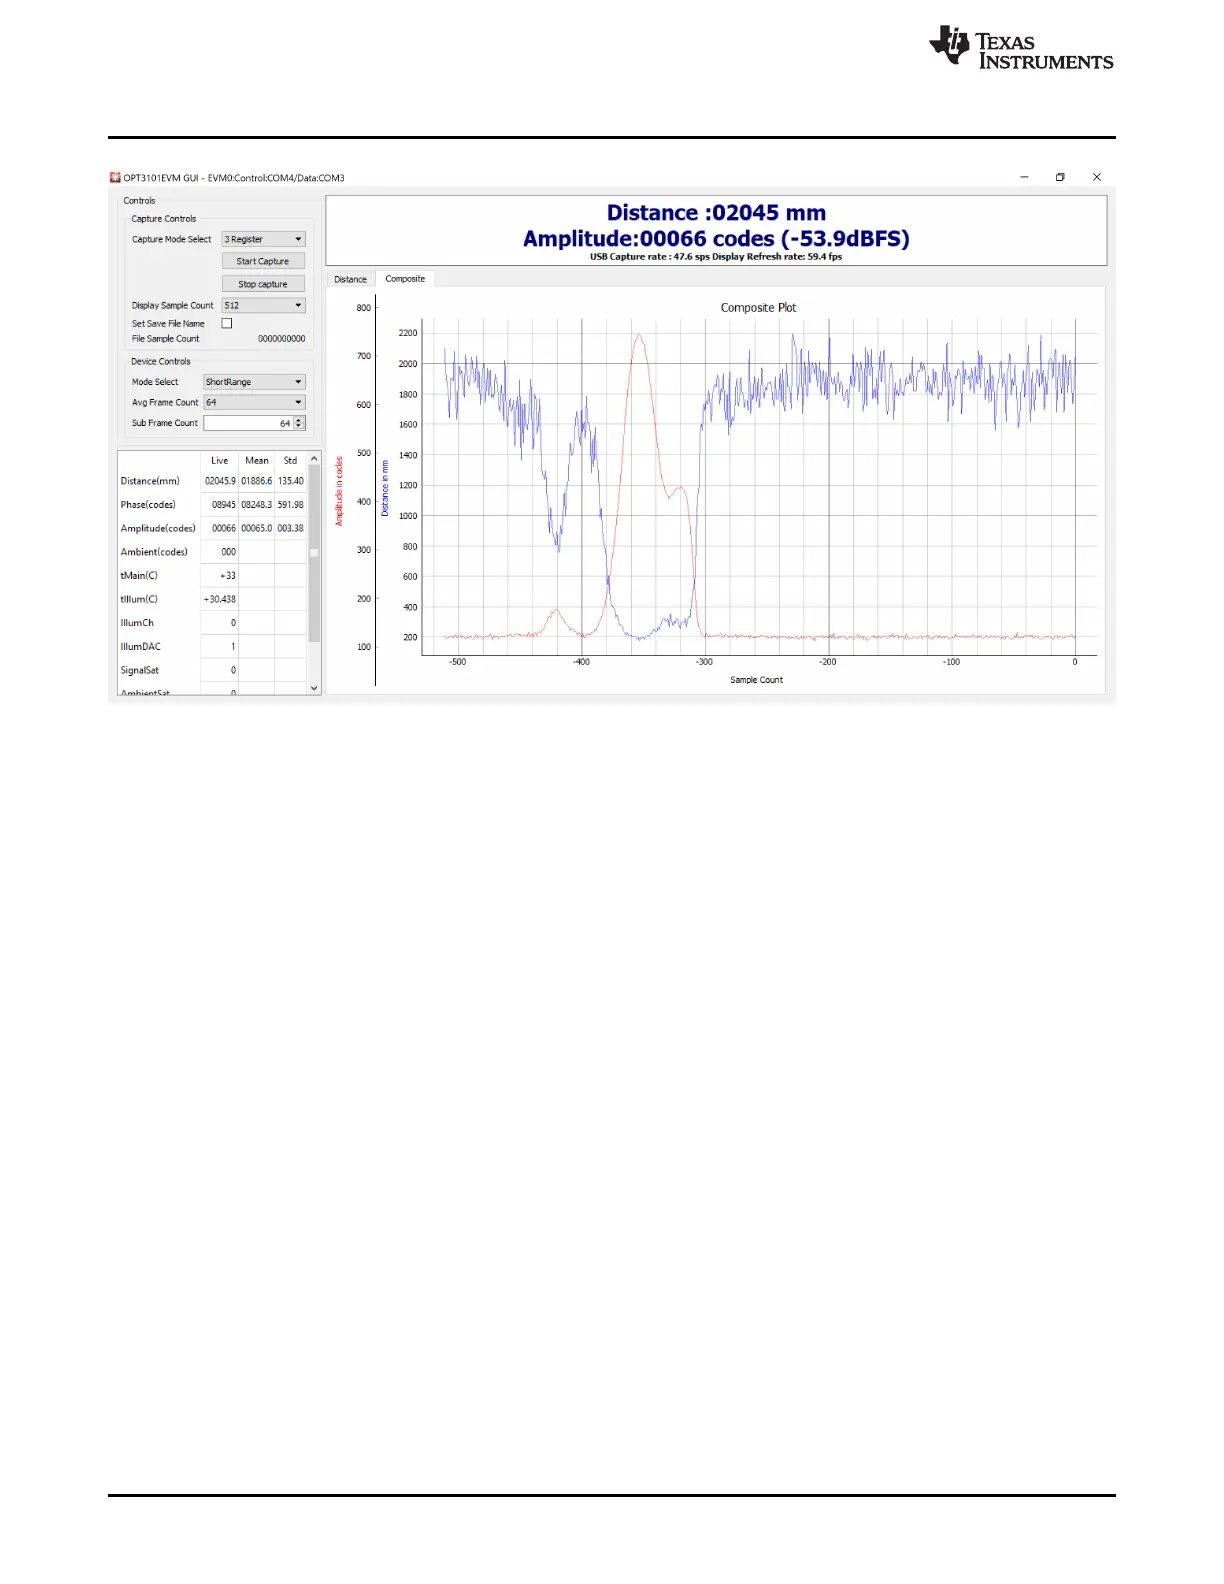
Figure 16. Composite Plot Showing Amplitude and Distance
Mean, Std, and the Blue Slider
There is a blue slider on the distance plot shown on the right side of the plot in Figure 15. Mean and Std
columns in the table where capture data is displayed are calculated from only the data within the blue
slider. Left-clicking on the middle of this slider and dragging moves the slider. Left-clicking on the edge of
either side of the slider and dragging will adjust the size of the slider. This allows the mean and standard
deviation of the distance, phase, and amplitude to be computed for any continuous portion of the
displayed data. If capture is running this data updates in real-time along with the data in the Live column.